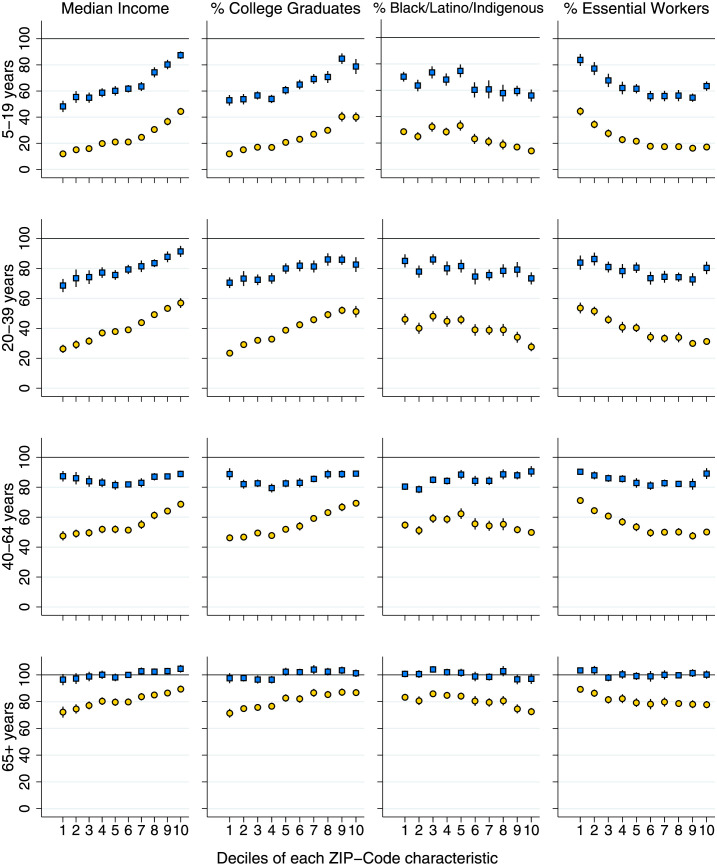
Fig 4. Percent vaccinated or boosted in each age group, by decile of ZIP-code characteristics.
Note: Plot displays % vaccinated (blue squares) and % boosted (yellow circles) for MA residents ages 5–19, 20–39, 40–64, and 65+ years, displayed by decile of four ZIP code characteristics. The first decile is the bottom 10% of ZIP codes, ranked by each covariate; the 10th decile is the top 10% of ZIP codes. Vertical spikes are 95% confidence intervals. Due to sampling error in the population denominators, neither point estimates nor CIs are constrained to be below 100%.

