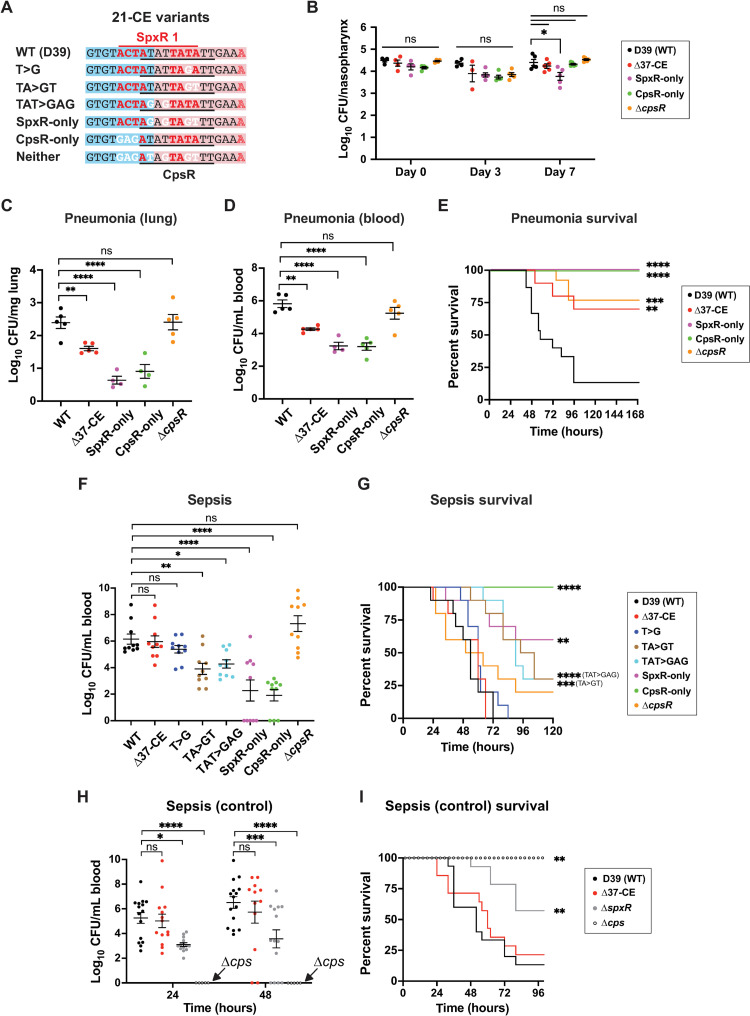
Fig 4. Infection studies.
(A) Representative 21-CE variants used in infections. (B) Colonization model. Mice were infected intranasally with 5x10^5 CFUs of 37/21-CE variants. CFUs were enumerated in nasopharyngeal washes on day 0, 3 and 7. (C, D & E) Pneumonia model. Mice were infected intranasally with 5x10^6 CFU. CFUs in lungs (C) and blood (D) were enumerated at 24 hours post-infection. Mouse survival is plotted in (E). (F & G) Sepsis model. Mice were infected via the dorsal tail vein with 2x10^6 CFU. Blood was withdrawn from the tail vein at 24 and 48 hours for enumeration of CFUs (F). Survival of mice from F are plotted in (G). (H & I) A sepsis model as performed in F with ΔspxR and Δcps strains. Survival of mice from H are plotted in (I). Statistics: For B, a two-way ANOVA was used with Dunnett’s multiple comparison test to determine differences between strains on the same day, and Tukey’s multiple comparison test to determine differences between the same strain on different days. For C and D a one-way ANOVA with Dunnett’s multiple comparison was used. For F and H a two-way ANOVA with Tukey’s multiple comparison test was used. Statistical differences in survival in E, G, and I were determined using the Kaplan-Meier and Log-rank tests for multiple comparisons. ns = not significant; * p≤0.05; ** p≤0.01; *** p≤0.001; **** p≤0.0001. Individual data points, the mean and SEM are plotted.

