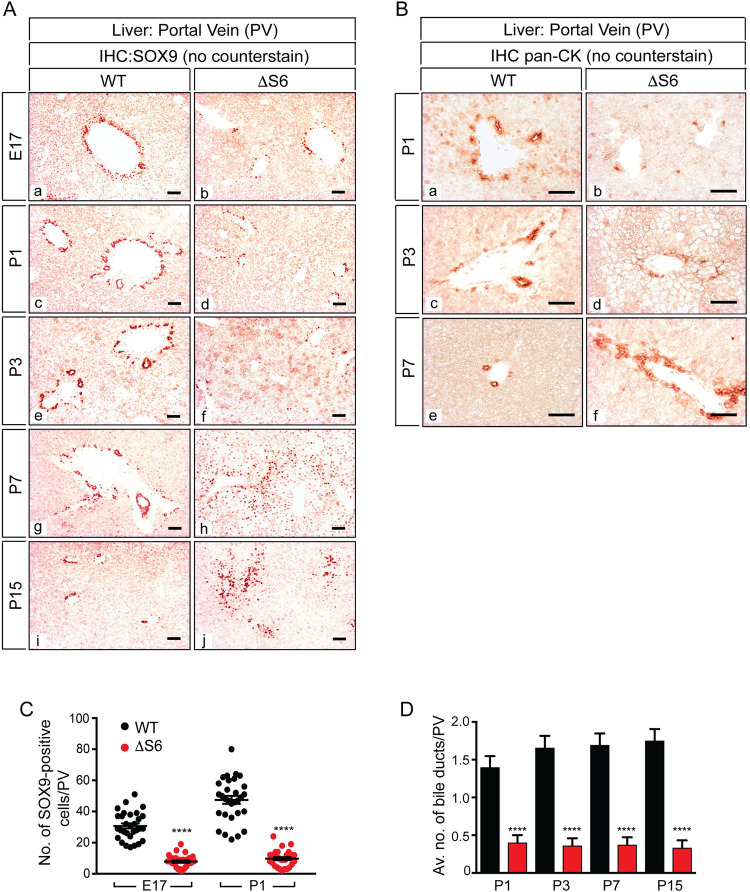
Fig 2. Hepatic Rps6-deficiency inhibits bile duct development.
(A) Photomicrographs of SOX9 IHC of WT (a, c, e, g, i) and ΔS6 (b, d, f, h, j) livers from E17 to P15 (Original magnifications, all x 125; 50μ scale bars) (AEC chromogen (red/orange), no counterstain). Note the gradual disappearance of SOX9-positive cells from the ductal plate in ΔS6 livers between E17-P3 and the abnormal position and expansion of SOX9-positive cells throughout the parenchyma from P7 onwards. (B) Photomicrographs of pan-CK IHC of WT (a, c, e) and ΔS6 (b, d, f) livers from P1 to P7 showing that the number of pan-CK-positive biliary cells in ΔS6 livers is also reduced at P1 and P3 (b and d) while their expansion at P7 (f) mirrors the increase in the number of SOX9-positive cells (A (h)) signifying emergence of a nascent ductular reaction. (Original magnifications, all x 250; 50μ scale bars) (AEC chromagen (red/orange), no counterstain). (C) Graph depicting quantitative analysis of the number of SOX9-positive cells around portal veins (PVs) in WT and ΔS6 livers at E17 and P1. ΔS6 livers have 20–25% of the normal number of SOX9-positive cells (mean values 7.8 vs 30.7 at E17; P < .0001 and 9.8 vs 47.5 at P1; P < .0001); 2-tailed unpaired Student’s t-test. (D) Graph showing average number of bile ducts per portal vein (PV) (bds/PV) in WT and ΔS6 livers at P1, P3, P7 and P15. While WT livers have an average of 1–2 fully formed bds/PV, ΔS6 livers have an average of < 0.5. Data are mean ± SEM; **** P < .0001; 2-tailed unpaired Student’s t-test.

