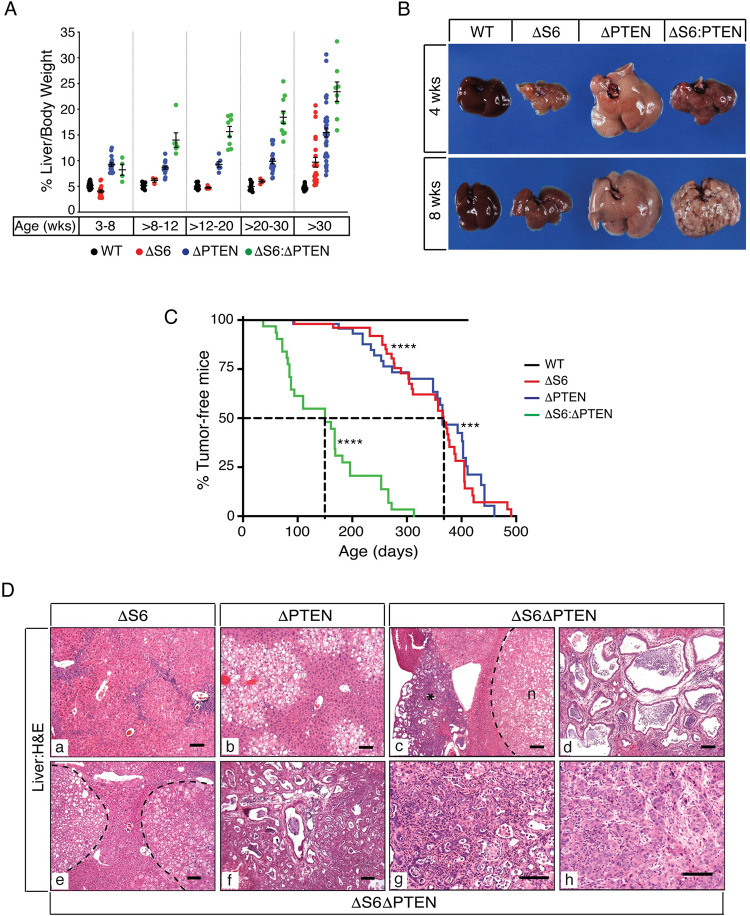
Fig 6. Rps6-deficiency lowers the threshold for tumor development in PTEN-deficient livers.
(A) Graph of %L/BWs in WT, ΔS6, ΔPTEN and ΔS6ΔPTEN mice at different ages showing accelerated growth of ΔS6ΔPTEN livers from ~12 weeks of age. For mean %L/BWs and P values, please see S2 Table. (B) Gross appearance of WT, ΔS6, ΔPTEN and ΔS6ΔPTEN livers at 4 and 8 weeks of age. Note the dramatic change in appearance of the ΔS6ΔPTEN liver between 4–8 weeks age as fatty nodules develop. (C) Kaplan-Meier curve showing % of liver tumor-free WT, ΔS6, ΔPTEN and ΔS6ΔPTEN mice. Age at which 50% of ΔS6, ΔPTEN and ΔS6ΔPTEN mice develop at least 1 liver tumor is 367, 365 and 150 days respectively. ***, P = .0001; ****,P < .0001. (Log-rank (Mantel-Cox) test). (D) Photomicrographs of H&E stained liver sections from a) a 3 month old ΔS6 mouse showing regenerative nodules and remnants of the dr, b) a 5.5 month old ΔPTEN mouse showing typical pericentral steatosis, c) a 5.5 month old ΔS6ΔPTEN mouse showing a nodule (n) compressing the parenchyma adjacent to an area displaying bile duct hamartomas (*), d) a 5.5 month old ΔS6ΔPTEN mouse with a bile duct hamartoma, e) a 10 week old ΔS6ΔPTEN mouse with fatty adenomas, f) an 8 week old and g) a 3 month old ΔS6ΔPTEN mouse with cholangiocarcinomas, and h) an 11 month old ΔS6ΔPTEN mouse with a trabecular HCC (f). Dashed lines denote nodule boundaries. Original magnifications; a, b, c, d (x 62.5); e, f (x 56.25); g, h (x 125); Scale bars, all 50μ.

