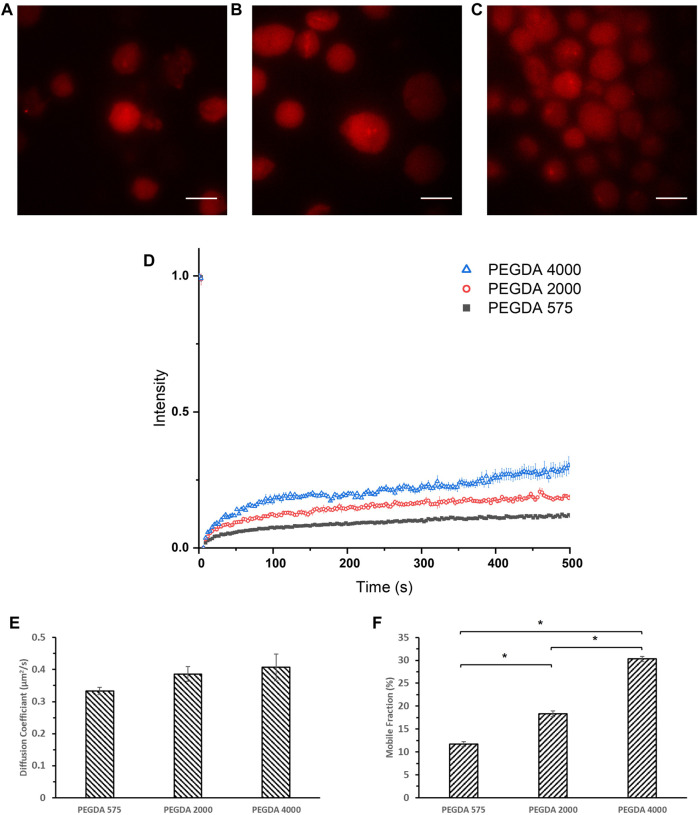
FIGURE 4.
Confocal images of (A) crosslinked PEGDA 575 MLG, (B) crosslinked PEGDA 2000 MLG, (C) crosslinked PEGDA 4000 MLG and (D) FRAP recovery curves of crosslinked PEGDA 575 MLG (Black Square), PEGDA 2000 MLG (Red Circle), PEGDA 4000 MLG (Blue Triangle). Unmarked scale bars in the figures represent 20 μm; (E) Diffusion Coefficients and (F) Mobile Fractions of PEGDA 575, 2000, 4,000 MLGs (*p < .05).

