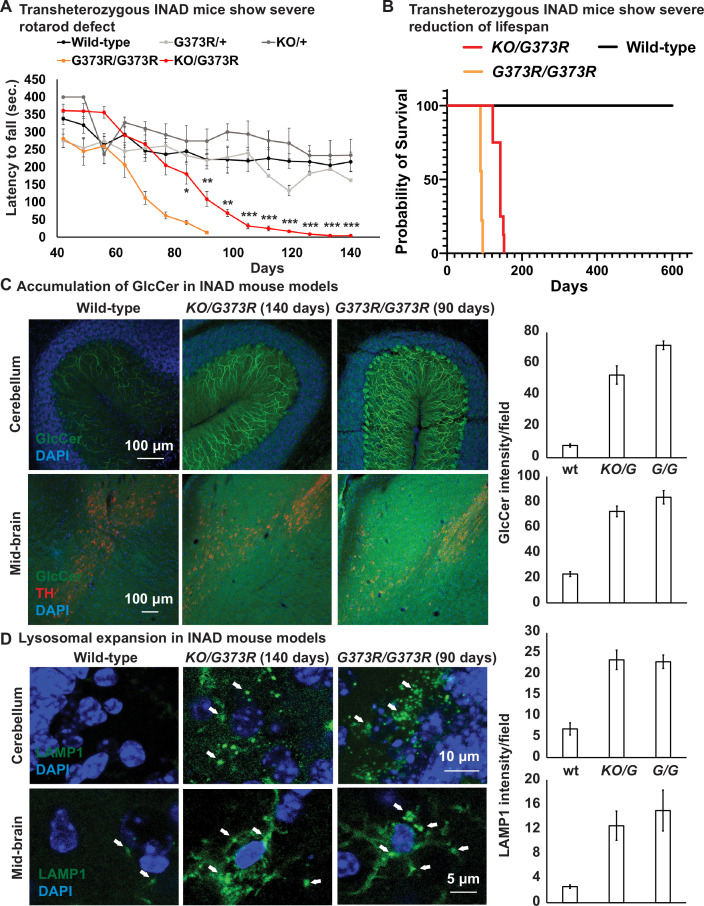
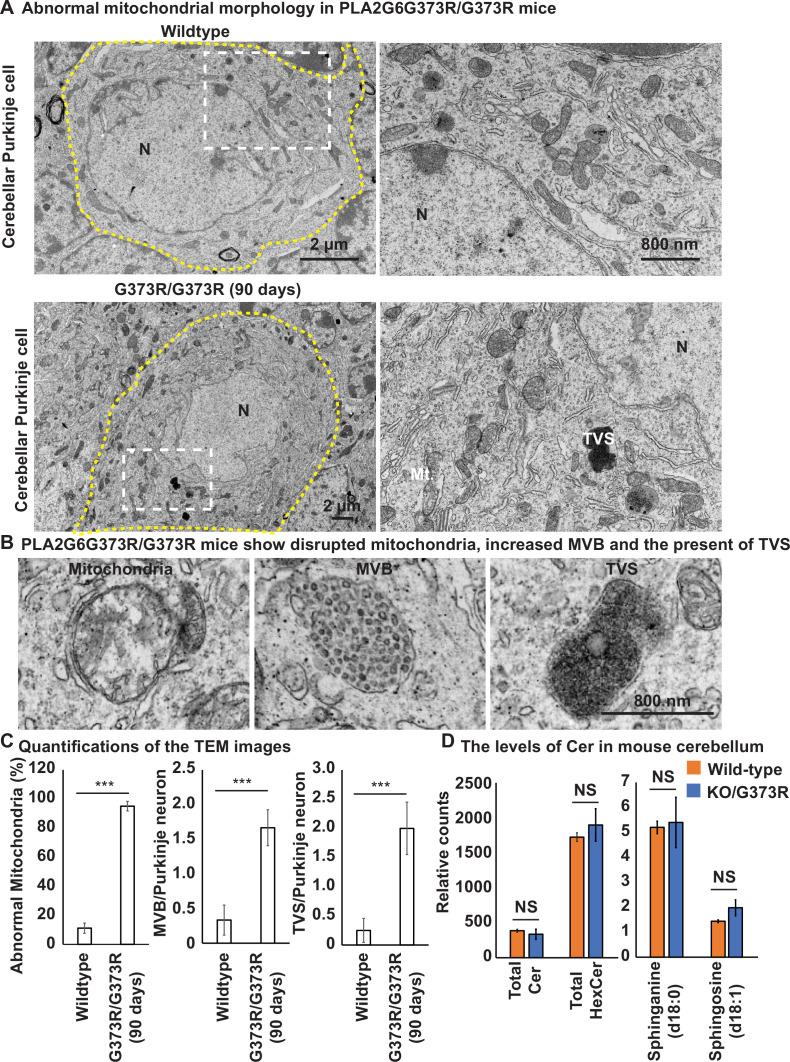
Figure 2. Ceramide accumulation, lysosomal expansion, and mitochondrial defects in mouse models of INAD.
(A) Both Pla2g6G373R/G373R and Pla2g6KO/G373R mice show severe rotarod defect. Rotarod performance of mice with the indicated genotypes was measured weekly. Wild-type (n=6); Pla2g6+/G373R (n=10); Pla2g6G373R/G373R (n=7); Pla2g6KO/+ (n=4); and Pla2g6KO/G373R (n=7). Error bars represent SEM. (B) Pla2g6G373R/G373R and Pla2g6KO/G373R mice fantile neuroaxonal dystrophy. A disease characterized by altered terminal axons and synaptic enshow a severe reduction of lifespan. Wild-type (n=6); Pla2g6G373R/G373R (n=9); and Pla2g6KO/G373R (n=8). (C) Accumulation of GlcCer in PLA2G6KO/G373R and PLA2G6G373R/G373R mice. Immunofluorescent staining of mouse cerebella and midbrain regions of the indicated genotypes. GlcCer antibody (green) was used to assess the levels of GlcCer. TH (Tyrosine Hydroxylase, red) antibody labels DA neurons in the midbrain region. Scale bar=100 µm. All assays were conducted in blind of genotypes and treatments. (D) Lysosomal expansion in INAD in Pla2g6KO/G373R and Pla2g6G373R/G373R mice. Immunofluorescent staining of mouse cerebella and midbrain regions of the indicated genotypes. LAMP1 antibody (green; arrows) labels lysosomes. DAPI (blue) labels nuclei. Representative images are shown in this figure. Quantifications are next to the images (n=3). Scale bar=10 µm (cerebellum) or 5 µm (midbrain). DA, dopaminergic; INAD, infantile neuroaxonal dystrophy.


