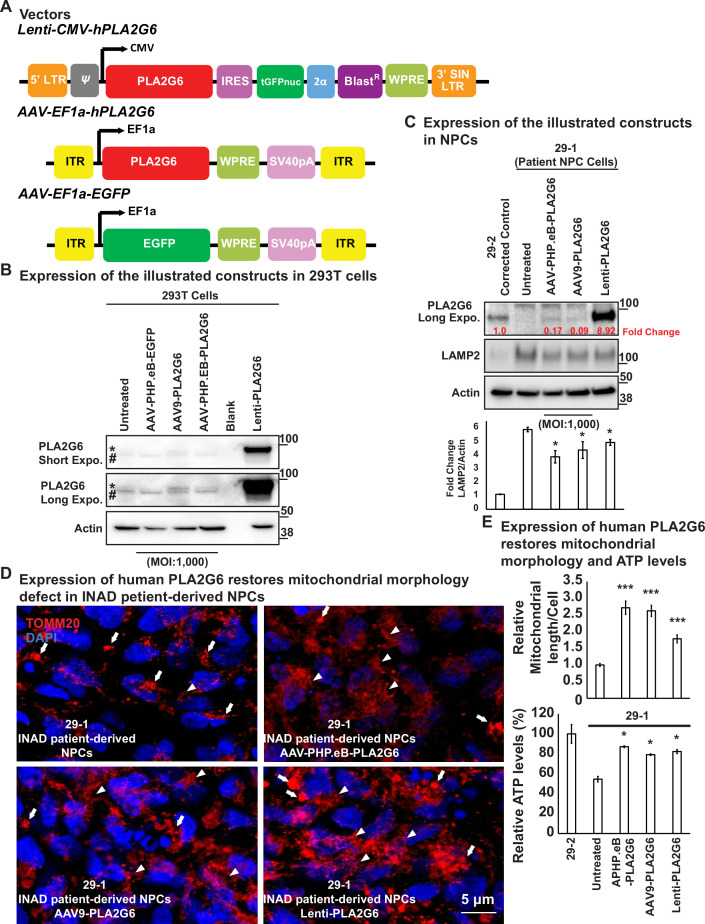
Figure 4. Expression of human PLA2G6 restores lysosomal and mitochondrial morphology defects in INAD patient-derived NPC lines.
(A) Vectors/constructs. (B) Expression levels of the constructs (A) in 293T cells. PLA2G6 antibody was used to detect the endogenous PLA2G6 of cellular lysates. * represents endogenous PLA2G6. # indicates a nonspecific band. All AAV constructs were used to infect 293T cell using a MOI of 1000. The MOI of the Lenti-viral-based construct was not determined. (C) Expression levels of the illustrated constructs (A) in NPCs. AAV constructs were used to infect NPCs at a MOI of 1000. The MOI of the Lenti-viral-based construct was not determined. The intensity of LAMP2/Actin is quantified below (n=3). (D) Expression of human PLA2G6 restores mitochondrial morphology defects in INAD patient-derived NPCs. Arrows indicate the fragmented and enlarged mitochondria. Arrowheads indicate the normal elongated network of mitochondria. (E) Expression of human PLA2G6 restores mitochondrial morphology and ATP levels. The length of the mitochondria in (D) is quantified in (E) (n=10; upper panel). The ATP levels are measure in the lower panel (n=3). Representative images are shown in this figure. Error bars represent SEM; *p<0.05; ***p<0.001 (the p values were calculated between the untreated patient NPCs (29-1) and the indicated treatment). INAD, infantile neuroaxonal dystrophy; MOI, multiplicity of infection; NPC, neural progenitor cell.


