. 2023 Jan 20;12:e80135. doi: 10.7554/eLife.80135

Figure 1. A CRISPR-mediated loss-of-function screen in polarized enterocytes.

(A) Dipeptidylpeptidase 4 (DPP4) localizes to the apical brush-border of polarized enterocytes and can be detected with a specific antibody at its extracellular stalk domain. Top view (XZ) and lateral view (YZ) of a polarized CaCo2 monolayer. Scale = 5 µm. (B) During polarization, apical DPP4 is increased due to polarized traffic and surface expansion, which can be measured by flow cytometry (right panel, CaCo2 unpolarized versus polarized). HEK293T cells, not expressing DPP4, serve as quality control for staining specificity. (C) CaCo2-Cas9 cells are transduced with the lentiGuide-Puro library and selected with puromycin. After selection, CaCo2 cells are seeded to confluent monolayers and cultured for apico-basolateral polarization. Subsequently, cells are detached, stained, and subjected to fluorescence-activated cell sorting (FACS). Sorted and unsorted control cells are processed for gDNA extraction and genomically integrated CRISPR constructs are amplified by PCR. Finally, PCR products of sorted and unsorted cell populations are analyzed by next-generation sequencing and sgRNAs are ranked by their enrichment in the sorted vs. unsorted cell polpulation. (D) Sorting was performed for 10% of the cells, with lowest surface-signal intensity, thereby enriching for the cell population that had lost 90% of surface DPP4 signal, due to efficient CRISPR targeting. (E) 89 single-guide RNAs were significantly enriched in the sorted cell population. (F) Factors enriched in the sorted cell population could functionally be associated with secretory traffic, cytoskeletal architecture, or transcription, in a manual gene -ontology analysis.

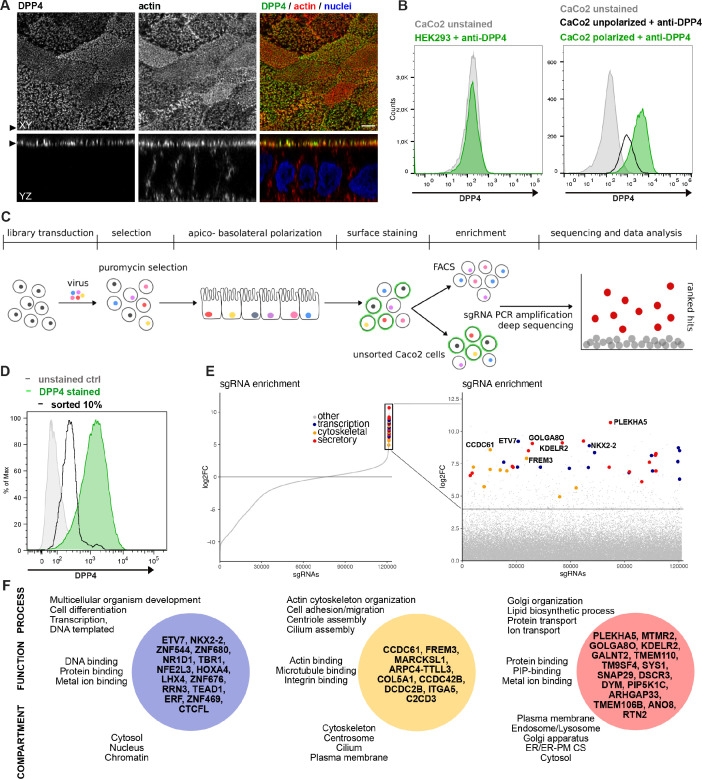
Figure 1.

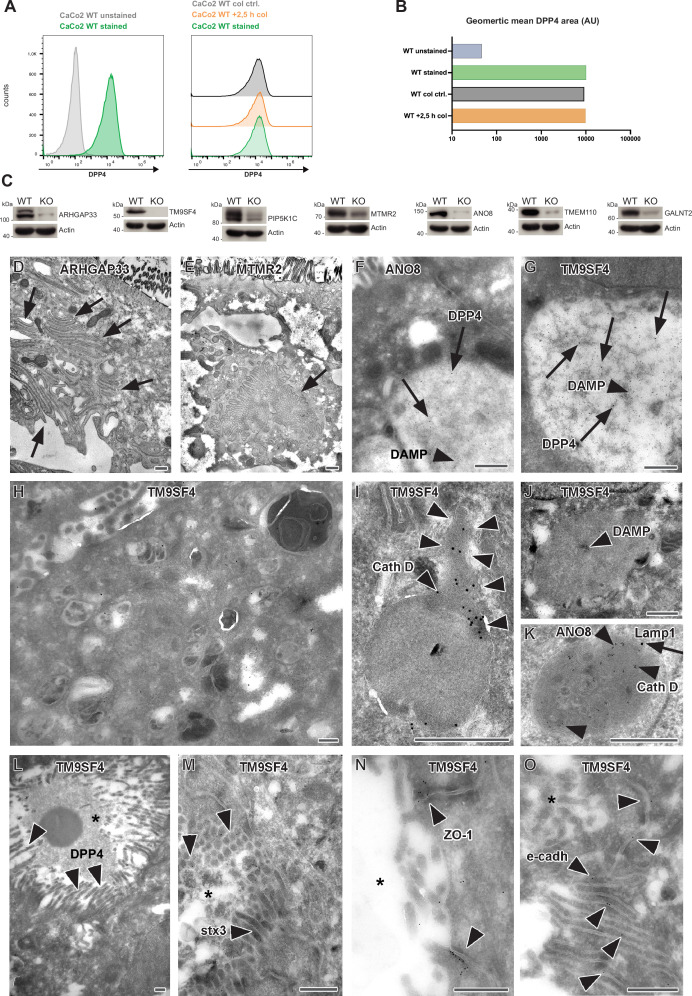
Figure 1—figure supplement 1. Colchine treatment of CaCo2 WT cells, validation of additional gRNA targeting, and complementary ultrastructure and immunoelectron microscopy on the phenotype of selected, polarized KO cells.

Figure 1—figure supplement 1.

(A) A flow cytometry assay was performed as described for our CRISPR screen. CaCo2 WT cells were polarized for 3 weeks and subsequently detached. After detachment, cells were either stained immediately for surface-DPP4 und subjected to flow cytometry or treated with 20 µM of colchicine for 2,5 hr. After 2.5 hr, colchicine-treated cells and corresponding control cells (incubation in FACS buffer for 2.5 hr) were stained for surface-DPP4 and subjected to flow cytometry measurements. No change in surface DPP4 signal can be detected upon induction of vacuolar apical compartments (VAC) with colchicine. (B) Quantification of surface-DPP4 signal of colchicine-treated and untreated cells. Induction of VAC formation with colchicine does not cause a reduction in surface DPP4 signal. (C) Generation of knockout (KO) cell lines of seven candidates with additional gRNAs. Protein levels that may remain in KO cells after CRISPR targeting were determined by Western blotting compared with wild-type (WT) cells. Beta-actin was used as loading control. Molecular size markers are depicted in kDa. (D) Paracellular microvilli a/o numerous interdigitations in cryo-fixed ARHGAP33 KO cells. (E) Intracellular microvillar cluster in cryo-fixed MTMR2 KO cell. (F) Mislocalized DPP4 (arrows) in a huge, acidic (i.e., DAMP-positive: arrow head) compartment in ANO8 KO cell. (G) Mislocalized DPP4 (arrows) in a huge DAMP-positive (arrowhead) compartment in TM9SF4 KO cell. (H–K) Normal late endosomal and lysosomal organelles as observed after serum starvation overnight. (H) Overview of TM9SF4 KO cell. (I) Reformed lysosome with cathepsin D immunogold label concentrated at its tubular part (outlined by arrowheads) in TM9SF4 KO cell. (J) Weak DAMP-immunogold label (arrow head) within newly formed lysosome/protolysosome in TM9SF4 KO cell. (K) Lamp1 (arrow) and cathepsin D (arrow heads) immunogold label in normal lysosome in ANO8 KO cell. (L) Ectopic DPP4 immunogold label (arrow heads) at basolateral, paracellular microvilli in TM9SF4 KO cell. (M) Ectopic stx3 immunogold label (arrowheads) at basolateral, paracellular microvilli TM9SF4 KO cell. (N) ZO1 immunogold label (arrowheads) at ectopic, basolateral tight junctions associated with paracellular microvillar spot (asterisk marks intercellular space) in TM9SF4 KO cell culture. (O) E-cadherin immunogold label (arrowheads) at basolateral adherens junctions adjacent to a paracellular microvillar spot (asterisk marks intercellular space) in TM9SF4 KO cell culture. (D–O) Scale = 500 nm.