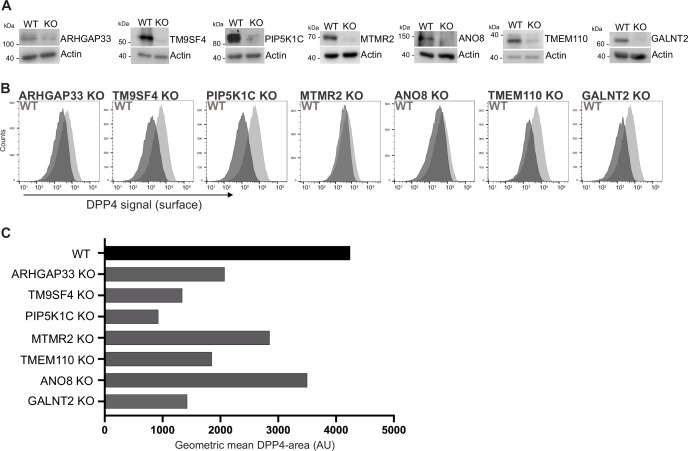
Figure 3. Validation of selected candidates identified in a CRISPR-mediated loss-of-function screen.
(A) Generation of clonal knockout (KO) cell lines of seven candidates chosen for primary CRISPR screen validation and further analysis. Any remaining protein levels in the KO clones after CRISPR targeting were determined by Western blotting compared with wild-type (WT) cells. Beta-actin was used as loading control. Molecular size markers are depicted in kDa. (B) The effect of the respective KOs on DPP4 surface transport, in KO cell lines. Cell lines were polarized for 18 days and then subjected to flow cytometry to determine the KO effect on DPP4 surface targeting. (C) Geometric means of DPP4-area (DPP4 intensity on the cellular surface) were determined of respective cell lines. All KO cell lines show varying extents of DPP4 surface reduction, with PIP5K1C-KO displaying the strongest and ANO8-KO the mildest effect.

