. 2023 Jan 31;12:e83077. doi: 10.7554/eLife.83077

Figure 2. T-REX17 cellular and molecular characterization.

(A) Time resolved qRT-PCR profiling SOX17 (green) and T-REX17 (orange) transcript levels during endoderm differentiation (normalized to the housekeeping gene 18s). Symbols indicate the mean and error bars indicate SD across three independent experiments. (B) Lineage tree heatmap showing SOX17 (green) and T-REX17 (orange) expression across EN derived embryonic and adult tissues as measured by RNA-seq, extracted from a curated data set of the Roadmap Epigenome Project (Roadmap Epigenomics Consortium et al., 2015; Supplementary file 1). TPM, transcripts per million. aPS, anterior primitive streak; AFE, anterior foregut endoderm; PFE, posterior foregut endoderm; MHG; mid-hindgut; PPT, Peyer’s patch tissue; S, sigmoid; T, transverse. (C) smRNA-FISH of T-REX17 in PSCs (left) and EN cells (right) counter-stained with Hoechst. Red arrowheads indicate two brighter and bigger foci present in each cell, potentially representing sites of nascent transcription. Scale bars, 10 µm. (D) Frequencies of T-REX17 smRNA-FISH foci in the nuclear (grey) or the cytoplasmic (white) compartments. n=79, number of analyzed cells. Lines of the violin plot indicate interquartile range around the median value. In the stacked barplot, error bars indicate SD around the mean value. (E) Barplots showing coding potential scores of randomly sampled LNCRNA ORFs (n=257,992) (grey) versus T-REX17 ORFs (n=40) (orange). Scores are shown on the x-axis while ORF-density is plotted on the y-axis. Both conditions area is equal and compared to SOX17 ORFs as coding gene control. n, number of analyzed ORFs. (F) Schematic of T-REX17 isoform structure derived from MinION-seq reads of endoderm cDNA. Exons are shown in orange while the poly(A) is shown in white. The arrow indicates the transcriptional start site (TSS). Pie chart shows isoform reads (Ex1+2 black n=16, Ex1+3 grey n=11) and ‘sloppy spliced’ (white n=89) transcript distribution as measured by MinIONseq (Supplementary file 1).

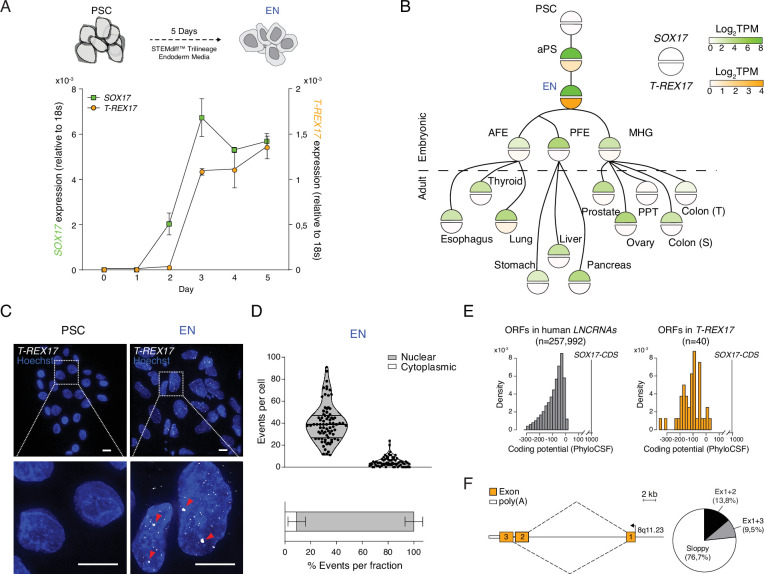
Figure 2.

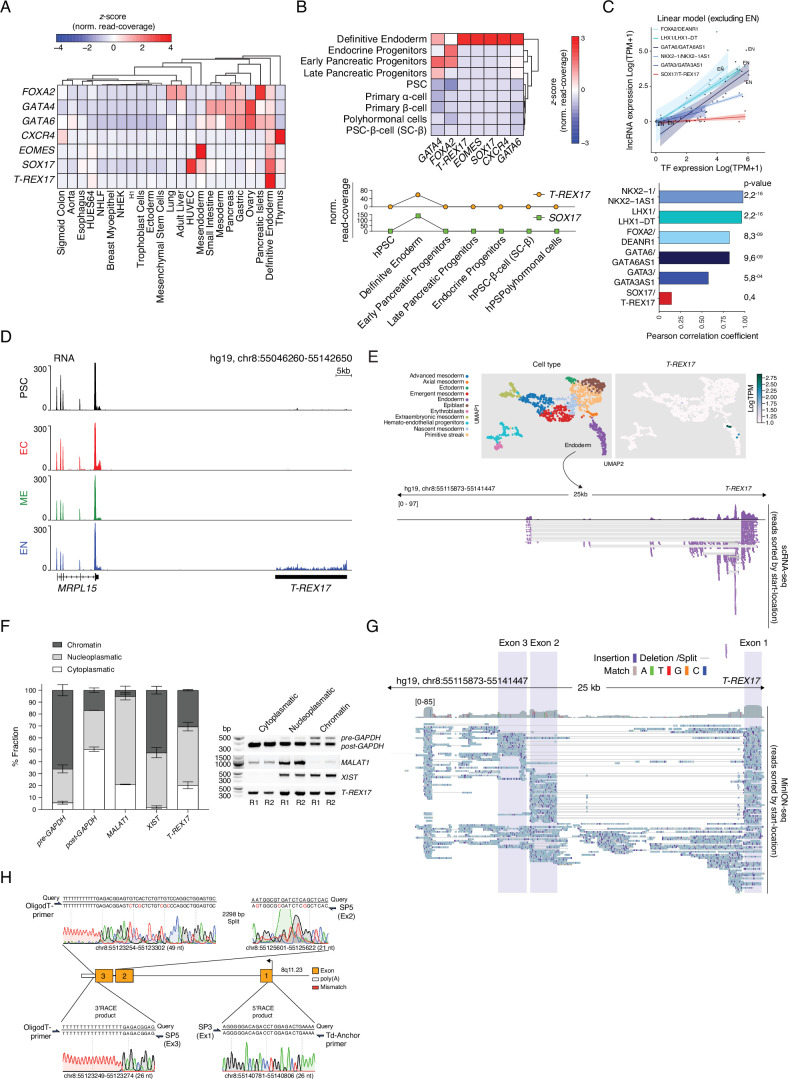
Figure 2—figure supplement 1. T-REX17 tissue distribution and structural characterization.

Figure 2—figure supplement 1.

(A) Heatmap showing row-normalized z-scores of EN marker genes and T-REX17 expression across various embryonic and adult tissues as measured by RNA-seq. The tree represents hierarchical clustering (based on Euclidean distance). RNA-seq expression values are calculated as normalized row-read-coverage. Note the high specificity of T-REX17 expression as compared to a much broader expression of endodermal transcription factors, including SOX17. A list of the curated dataset from the Roadmap Epigenome project used in this heatmap is provided in Supplementary file 1. (B) Heatmap showing column-normalized z-scores of EN marker genes and T-REX17 expression during in vitro pancreatic lineage differentiated cell types including primary isolated α- and β-cells as measured by RNA-seq (Alvarez-Dominguez et al., 2020) (upper panel). The tree represents hierarchical clustering (based on Euclidean distance). RNA-seq expression values are calculated as normalized row-read-coverage. T-REX17 and SOX17 expression profiles plotted as row-read-coverage normalized z-scores of the indicated in vitro generated cell type during pancreatic differentiation (lower panel). Note the transient and restricted expression of T-REX17 specifically in definitive endoderm. (C) Scatter plot showing the expression of a set of endoderm lncRNAs (DEANR1, LHX1-DT, GATA6AS1, NKX2-1AS1, GATA3AS1, T-REX17) and the corresponding TFs (FOXA2, LHX1, GATA6, NKX2-1, GATA3, SOX17) in the same set of EN tissues of Figure 2B. A linear model excluding the expression in EN was fit for each lncRNA-TF couple. Pearson correlation coefficients as well as corresponding p-values are displayed in the bar-plot (bottom panel). Note that the T-REX17-SOX17 couple has the lowest degree of tissue co-expression. (D) Genome browser tracks displaying RNA levels at the T-REX17 locus in PSCs and the three germ layers. Note T-REX17 expression specificity as compared to MRPL15. (E) Uniform Manifold Approximation and Projection for Dimension Reduction (UMAPs) showing cell states (upper left panel) and T-REX17 expression (upper right panel) in cells derived from a human gastrulating embryo (Tyser et al., 2021). ScRNA-seq track from cells belonging to the endoderm cluster showing reads mapping to the T-REX17 locus (bottom panel). (F) Cell fractionation of endodermal cells followed by RT-PCR, agarose gel purification and band intensity quantification. Right panel indicates PCR products of respective target gene RNA of the respective cell fraction. Left panel indicates relative band intensity quantification (provided in Supplementary file 1) of respective cell fraction (dark grey=chromatin fraction, light grey=nucleoplasmatic fraction, white = cytoplasmatic fraction) from RT-PCR-products in the left panel. Bar heights of each fraction represent mean values, error bars indicate SD (n=2). (G) MinION-seq reads track showing T-REX17 coverage and structure in endodermal cells. Sequencing read distribution histogram (top) and individual reads sorted by their start location (bottom) are displayed. Exon 1, 2, and 3 are highlighted by shading boxes. Sequence mismatches and matches are color coded as described. Split reads and deletions are shown as thin horizontal lines. (H) Sanger sequencing of 3’/5’ RACE PCR products. Amplicon-specific sequencing results are shown below the query sequence (hg19). Sequencing mismatches are highlighted in red. Primer pairs relative positions used for the PCRs are shown for each product. Sanger sequencing chromatogram color code is used to show the raw reads data.
Figure 2—figure supplement 1—source data 1. Source data for the cell fractionation assay in Figure 2—figure supplement 1F.
Figure 2—figure supplement 1—source data 2. Sanger sequencing files for the 5’ and 3’ RACE experiment in Figure 2—figure supplement 1H.