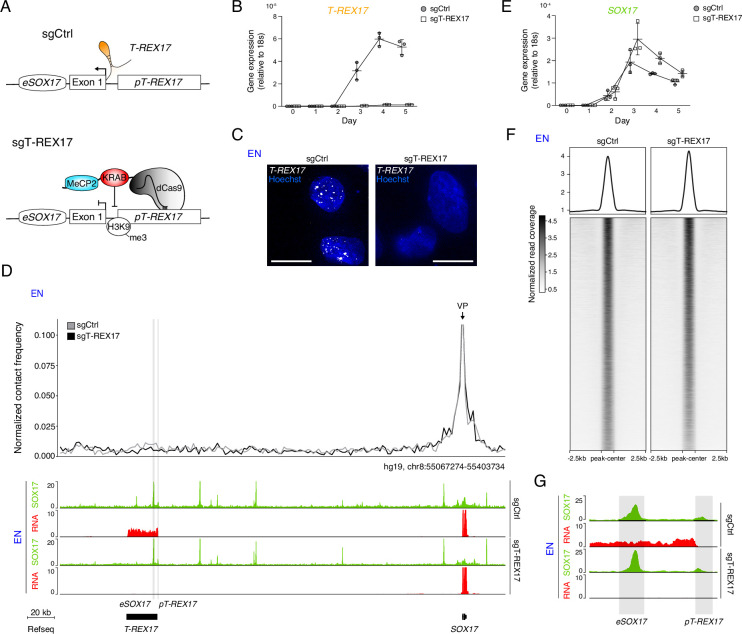
Figure 3. T-REX17 regulation at the SOX17 topological domain.
(A) Schematic of T-REX17 locus regulation in the absence (top) or presence (bottom) of a targeting dCas9-KRAB-MeCP2 complex, decorating T-REX17 promoter with an H3K9me3 mark 355 bp upstream of the TSS. (B) Time-resolved qRT-PCR showing the expression of T-REX17 during EN differentiation in the presence or absence of dCas9-KRAB-MeCP2 complex targeting T-REX17 promoter (normalized to the housekeeping gene 18s). Symbols indicate the mean and error bars indicate SD across three independent experiments. Individual data points are displayed. (C) smRNA-FISH of T-REX17 in sgCtrl (left) and sgT-REX17 (right) EN cells counter-stained with Hoechst. Scale bars, 10 µm. For an extended field of view see Figure 3—figure supplement 1B. (D) Virtual 4C analysis from capture Hi-C experiments in sgCtrl and sgT-REX17 EN cells using SOX17 promoter as viewpoint, with 2 kb resolution (upper panel). SOX17 EN ChIP-seq (RPKM) and RNA-seq (CPM) profiles in the two conditions are shown in the tracks (lower panel). eSOX17 and pT-REX17 are highlighted in grey. (E) Time-resolved qRT-PCR showing the expression of SOX17 during EN differentiation in the presence or absence of dCas9-KRAB-MeCP2 complex targeting T-REX17 promoter (normalized to the housekeeping gene 18s). Symbols indicate the mean and error bars indicate SD across three independent experiments. Individual data points are displayed. (F) Heatmap showing SOX17 binding distribution genome-wide in sgCtrl and sgT-REX17 EN. The displayed peaks represent the union of the identified peaks in the two conditions (n=61.153). (G) SOX17 ChIP-seq and RNA-seq tracks at the T-REX17 locus showing SOX17 binding at the SOX17 enhancer (eSOX17) and T-REX17 promoter (pT-REX17). SOX17 binding on pT-REX17 results in T-REX17 activation, if pT-REX17 is not targeted by dCas9-KRAB-MeCP2.


