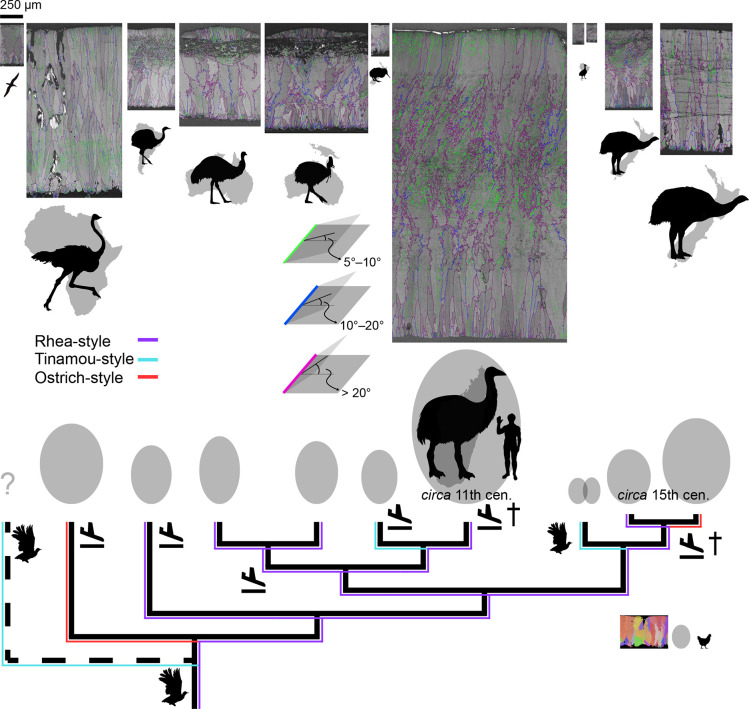
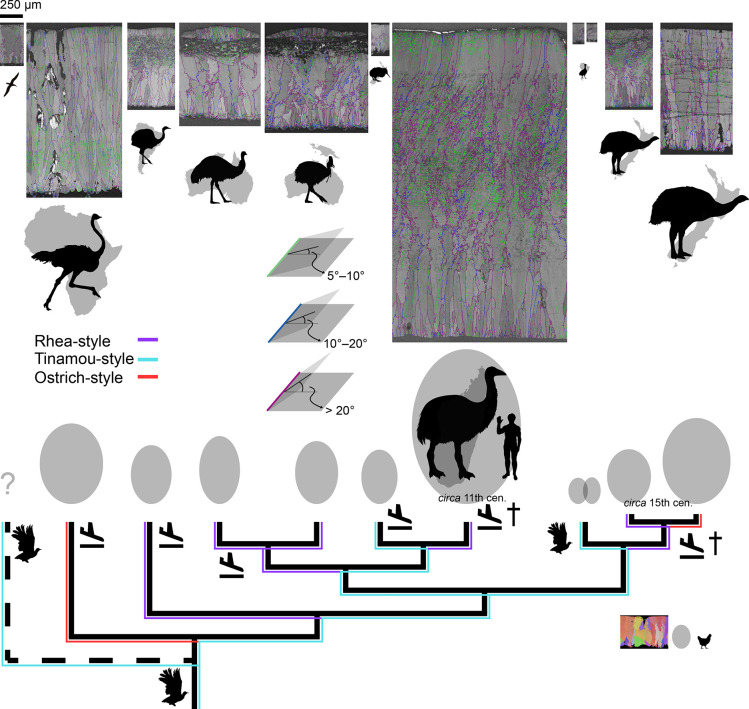
Figure 14. GB mappings, eggshell thickness, and egg size of Palaeognathae.
The green, blue, and purple lines in GB mapping denote the angle range between the calcite grains. All eggshell maps (including IPF mapping of chicken eggshell for comparison) are drawn to scale; note a scale bar at the upper left corner. The silhouettes of palaeognath are drawn to scale (note a human next to elephant bird and a chicken at the lower right corner). Egg shape and size are drawn to scale (Hauber et al., 2014; Stoddard et al., 2017). Two recently extinct lineages are marked by daggers and the extinct Lithorinithidae by a dashed branch. Landing symbols denote potential independent losses of flight (Mitchell et al., 2014; see also Sackton et al., 2019) and flying bird silhouettes denote volant taxa. Sky blue lines show microstructural and crystallographic similarities among tinamou-style eggshells that is attributable to homoplasy. Red lines mean the homoplastic similarities between ostrich-style eggshells. Purple lines represent potential homologies of rhea-style eggshells.


