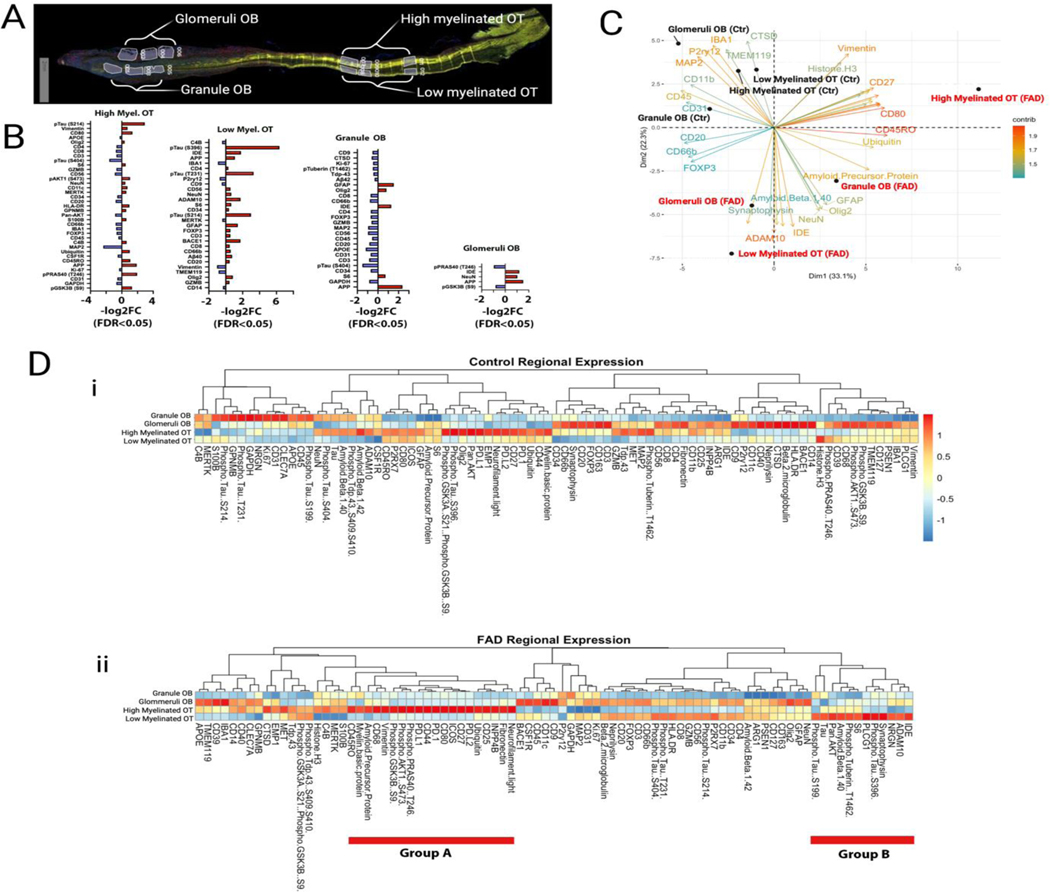
Figure 3.
nanoString Proteomic Analysis of OB and OT Expression of Markers for AD and Immunity
(A) Representative tissue section stained for myelin basic protein (MBP) showing the regions that were used for protein quantification. In the OB “Glomeruli OB” included the glomerular layer (GL) and the external plexiform layer (EPL), “Granule OB” included the granule cell layer and the accessory olfactory nucleus (AON). In the OT the high and low myelinated areas were determined by high and low MBP staining. (B) Log 2 fold change for the levels of protein expression in the different tissue regions. Red denotes higher expression in FAD. Only the proteins whose levels are significantly different between genotypes are shown. (C) Principal component analysis of the protein levels of expression. (D) Pseudocolor plots comparing between regions the levels of expression for all proteins. Proteins are segregated by Euclidean distance calculated by the total normalized reads for each protein between tissue regions or samples. i. Control tissue. ii. FAD. Group A are adjacent proteins that display higher levels in high myelinated OT and group B are adjacent proteins that display higher levels in low myelinated OT.

