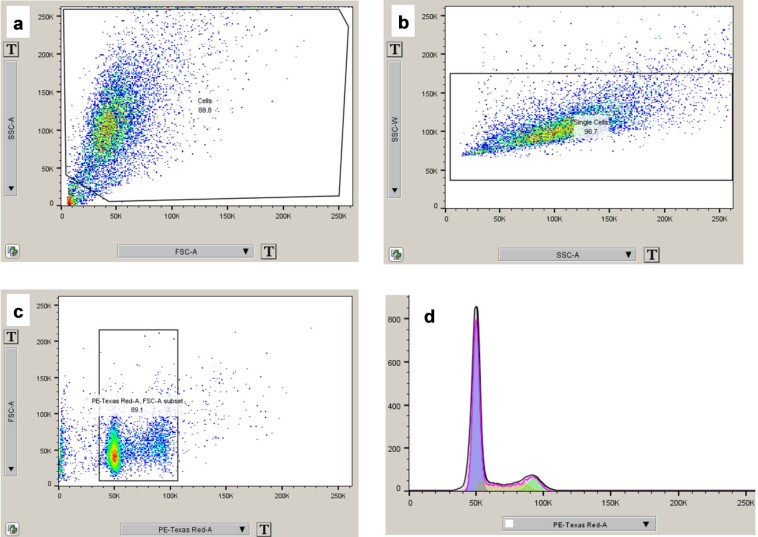
Extended Data Fig. 7. Gating strategy for flow cytometry experiments.
Images captured directly from FloJo 10.7.1. (a) After collecting at least 10,000 events for each sample, each sample was gated on a plot of FSC-A vs SSC-A to separate debris from cells (retaining 70–90% of events). (b) This cell population was then gated on SSC-W vs SSC-A to separate single cells (91–98%). (c) The single cell population was then gated on FSC-A vs propidium iodide fluorescence to remove unstained cells and other outliers (89–97%). (d) This final population was then plotted as a histogram and fit to the Watson Model. In some cases, noise in the data made automatic unconstrained fitting impossible, and the fitting process was aided by constraining the G1 peak center to the left (less fluorescent) half of the population and setting the condition that the G2 peak CV = G1 peak CV. In all cases, the same gate values were applied to every sample at each stage of gating.

