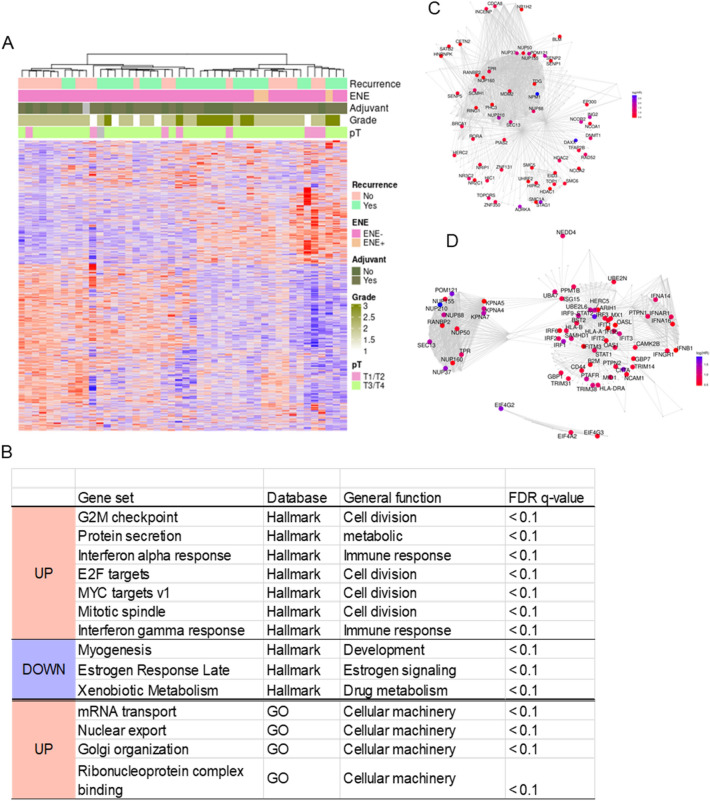
Figure 1.
Transcriptional profiling to predict prognosis of ACC patients. (A) Heatmap for hierarchical clustering of relevant genes selected based on DFS hazard ratio (p value < 0.05). Clinicopathologic ACC features shown in the upper panels. (B) Pathways enriched in patients with short DFS by GSEA with Hallmark and GO genesets. (C,D) REACTOME pathways for SUMOylation and Interferon Signaling. Color band displays the log (HR) value for the leading-edge genes in each pathways.

