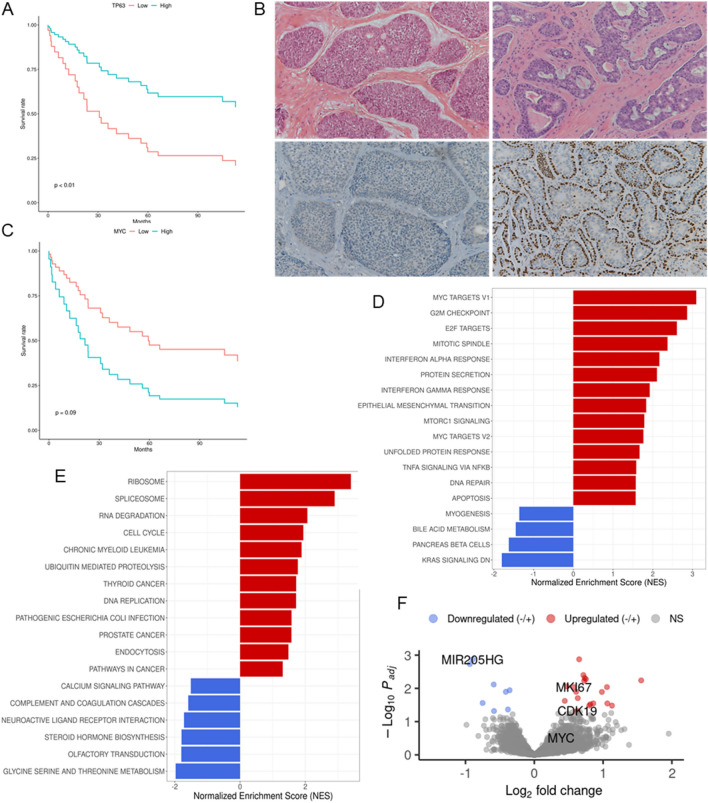
Figure 2.
Distinct transcriptional features are associated with p63-negative ACC. (A–C) Kaplan–Meier curves showing the DFS as a function of TP63 or MYC mRNA expression. p-value computed from Likelihood Ratio Test (LRT). (B) Representative cases of ACC showing either diffuse strong nuclear p63 immunostaining in more than 70% of tumor cells (low right panel) or completely negative p63 expression (low left panel). Corresponding H&E sections are shown in the upper panel (10 × magnification). (D,E) Functional enrichment analysis depicting biological processes up-regulated in p63neg ACC group compared to p63pos tumors, considering both Hallmark and KEGG genesets. Each distribution represents the t-statistic associated to the core-enrichment genes of each pathway. (F) Volcano plot of genes with increased expression in p63neg (red dots) and p63pos (blue dots) ACCs.

