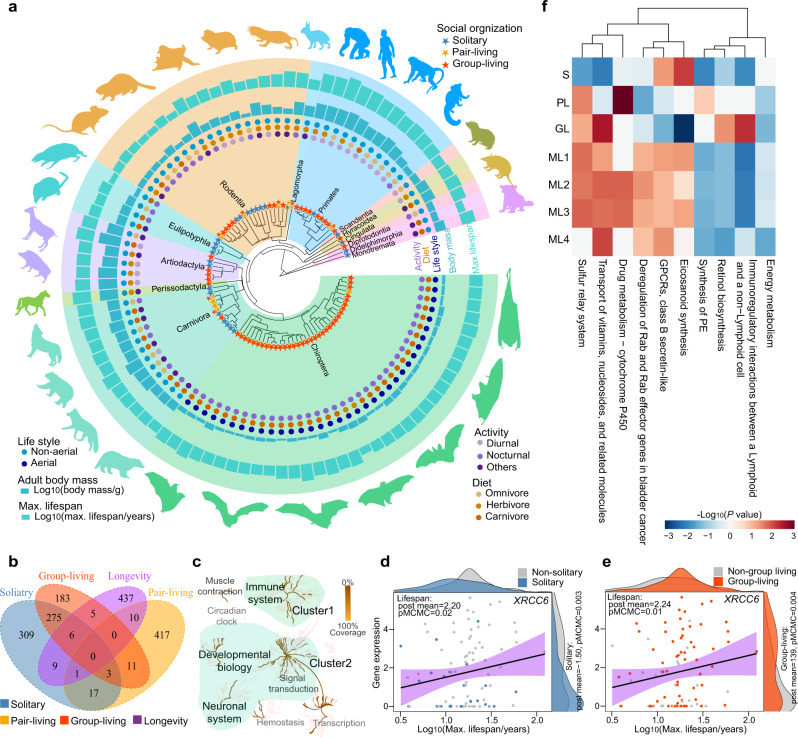
Fig. 2. Genes and pathways whose expression was correlated with social organization and longevity in 94 mammalian species.
a Species (n = 94) with RNA-seq and six life history traits (social organization, activity, diet, lifestyle, adult body mass, and longevity) used in the MCMCglmm analyses. Colorful shadings display different mammals’ orders. Silhouette images of animals are from PhyloPic database [http://phylopic.org/]. b Venn diagram showing the number of significant overlapping genes across solitary, pair-living, group-living, and longevity. c Clusters according to the function of 31 genes that were significantly associated with social organization and longevity. Each node represents a pathway from the Reactome database34, 35; pathways in which significant genes were involved are colored brown. Light green shading represents two clusters of gene function. d, e Example of a significant gene (XRCC6) that was downregulated in solitary species, upregulated in group-living species and also positively correlated with lifespan; the regression lines were generated from the linear regression model. Purple range display 95% confidence interval around the smooth line. Coefficients (post mean) and P-values (pMCMC) from the MCMCglmm analyses are also shown. The number of species used in the MCMCglmm was n = 94. f A heat map showing pathways that were significantly associated with social organization and longevity. S: solitary; PL: pair-living; GL: group-living; ML1–ML4: longevity in model 1 to model 4 (see “Methods”). Color code for social organization and longevity: blue = solitary; orange = pair-living; red = group-living; purple = lifespan. Source data are provided as a Source data file.

