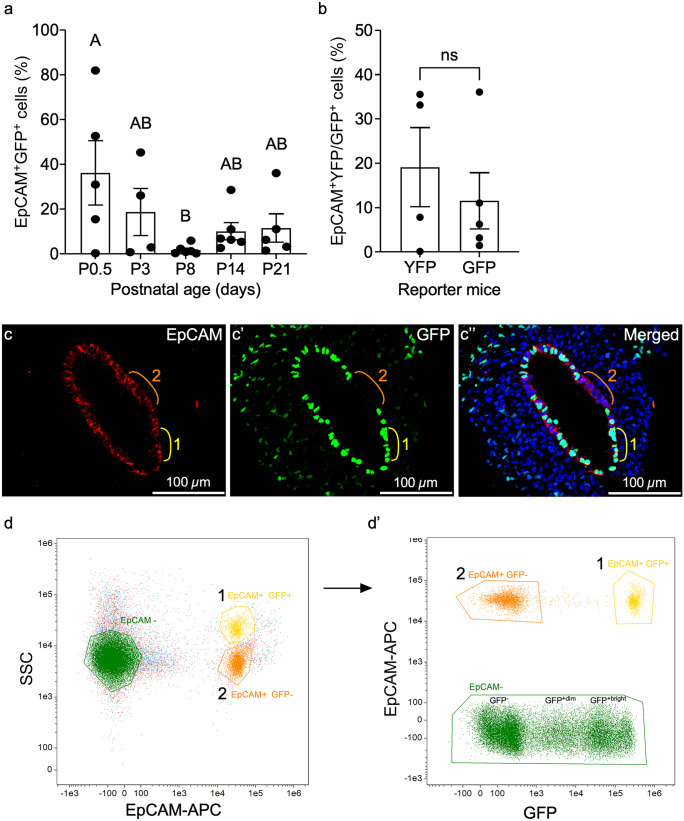
Fig. 4.
Mesenchymal-derived (MD) cells populate the epithelium during postnatal uterine maturation. (a) EpCAM+GFP+ (MD) epithelial cells from Amhr2-Cre; Rosa26-tTA; H2B-GFP mouse uteri at postnatal day (P) 0.5, P3, P8, P14, and P21 were analyzed by flow cytometry and graphed. (b) Graphical comparison of the percentages of endometrial EpCAM+YFP+ and EpCAM+GFP+ cells analyzed by flow cytometry from Amhr2-Cre; Rosa-EYFP and Amhr2-Cre; Rosa26-tTA; H2B-GFP female mice, respectively, at P21. (c–c’’) Representative uterine cross section from an Amhr2-Cre; Rosa26-tTA; H2B-GFP mouse uterus at P0.5, corresponding to high % of EpCAM+GFP+ cells in (a), showing examples of EpCAM+GFP− non-MD-epithelial cells (region 2, orange line), and EpCAM+GFP+ MD-epithelial cells (region 1, yellow line). Regions are represented in flow cytometry plots in (d, d’). (d) Representative flow cytometry plot from P0.5 mouse uterus of EpCAM+ epithelial cells that segregated into two populations (1 and 2) by side scatter (SSC). EpCAM- cells are also represented. (d’) EpCAM+ populations 1 and 2 from (d) were plotted by EpCAM and GFP expression. Population 1 with higher SSC in (d) was GFP+ in (d’) and population 2 with lower SSC in (d) was GFP− in (d’). EpCAM− cells from (d) are represented in (d’) and segregated into GFP−, GPF+dim, and GFP+bright. Statistical analyses were performed by one-way ANOVA (a) and t-test (b), with significance at P < 0.05 indicated by different letters. ns, not significant. EpCAM, epithelial cell adhesion molecule

