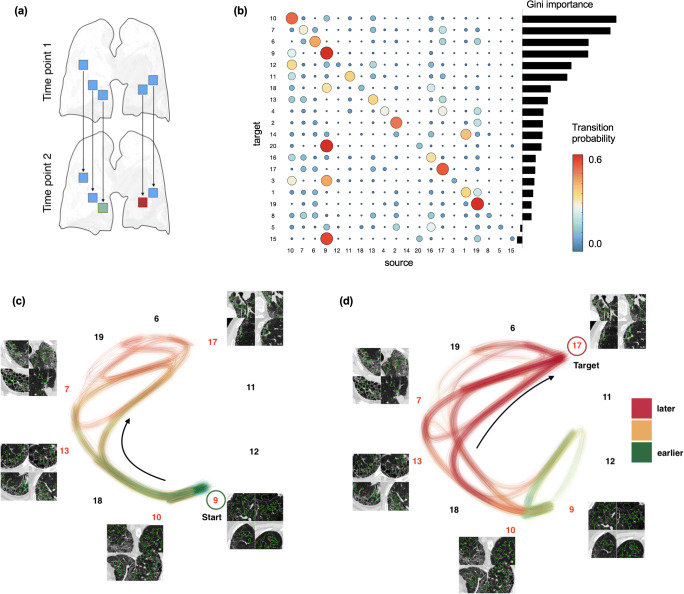
Fig. 4.
Pattern transition networks: mapping local pattern transition networks to reconstruct pathway candidates. a From the population of spatially matched follow-up pairs of lungs, we can observe local change of lung tissue from one to another pattern. (b) This enables obtaining a network of transition probabilities of lung patterns changing to others from one to the next examination time point. The matrix shows how likely a source pattern transitions to a target pattern. Red indicates high probability, blue low probability. These probabilities are generated by an underlying latent transition network that exhibits transition pathways shown in this figure. For the top ranked most informative patterns, we plot two pathways to illustrate this model. c Pathways originating from a healthy pattern (cluster 9), and (d) pathways ending in vessels and ground glass pattern (cluster 17). Arrows point at dominant directions in the graph

