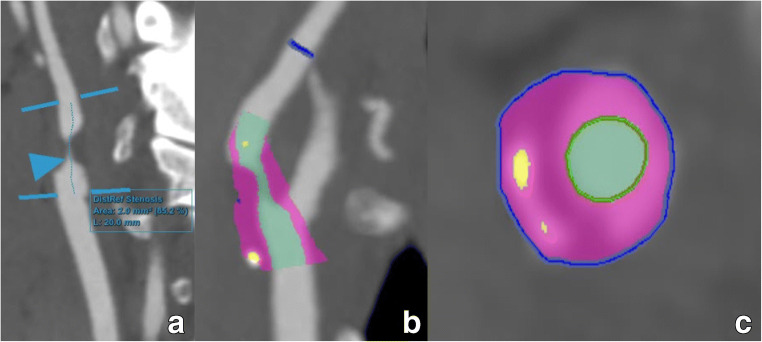
Fig. 12.
Contemporary post-processing examples of stenosis and plaque analysis software applications. A severe internal carotid artery stenosis is shown on a c-MPR image (a) obtained through automated tracking software along the trajectory of this vessel. Subsequent analysis using AI-driven software tools reveals an area stenosis of 85%. Area stenosis measurements on CT images are difficult to implement in routine practice due to often necessary manual corrections, increasing post-processing time. AI tools may, as in this example, improve analysis time while delivering more accurate results. Further analysis using color-coding of different plaque components in two views (b, c) reveals that while the plaque is mainly composed of non-calcified components (purple), there are some scattered plaque calcifications (yellow). Note also the very good delineation of the lumen (green) vs the surrounding plaque (purple), a result obtained through an AI algorithm delivering more accurate results than previously possible

