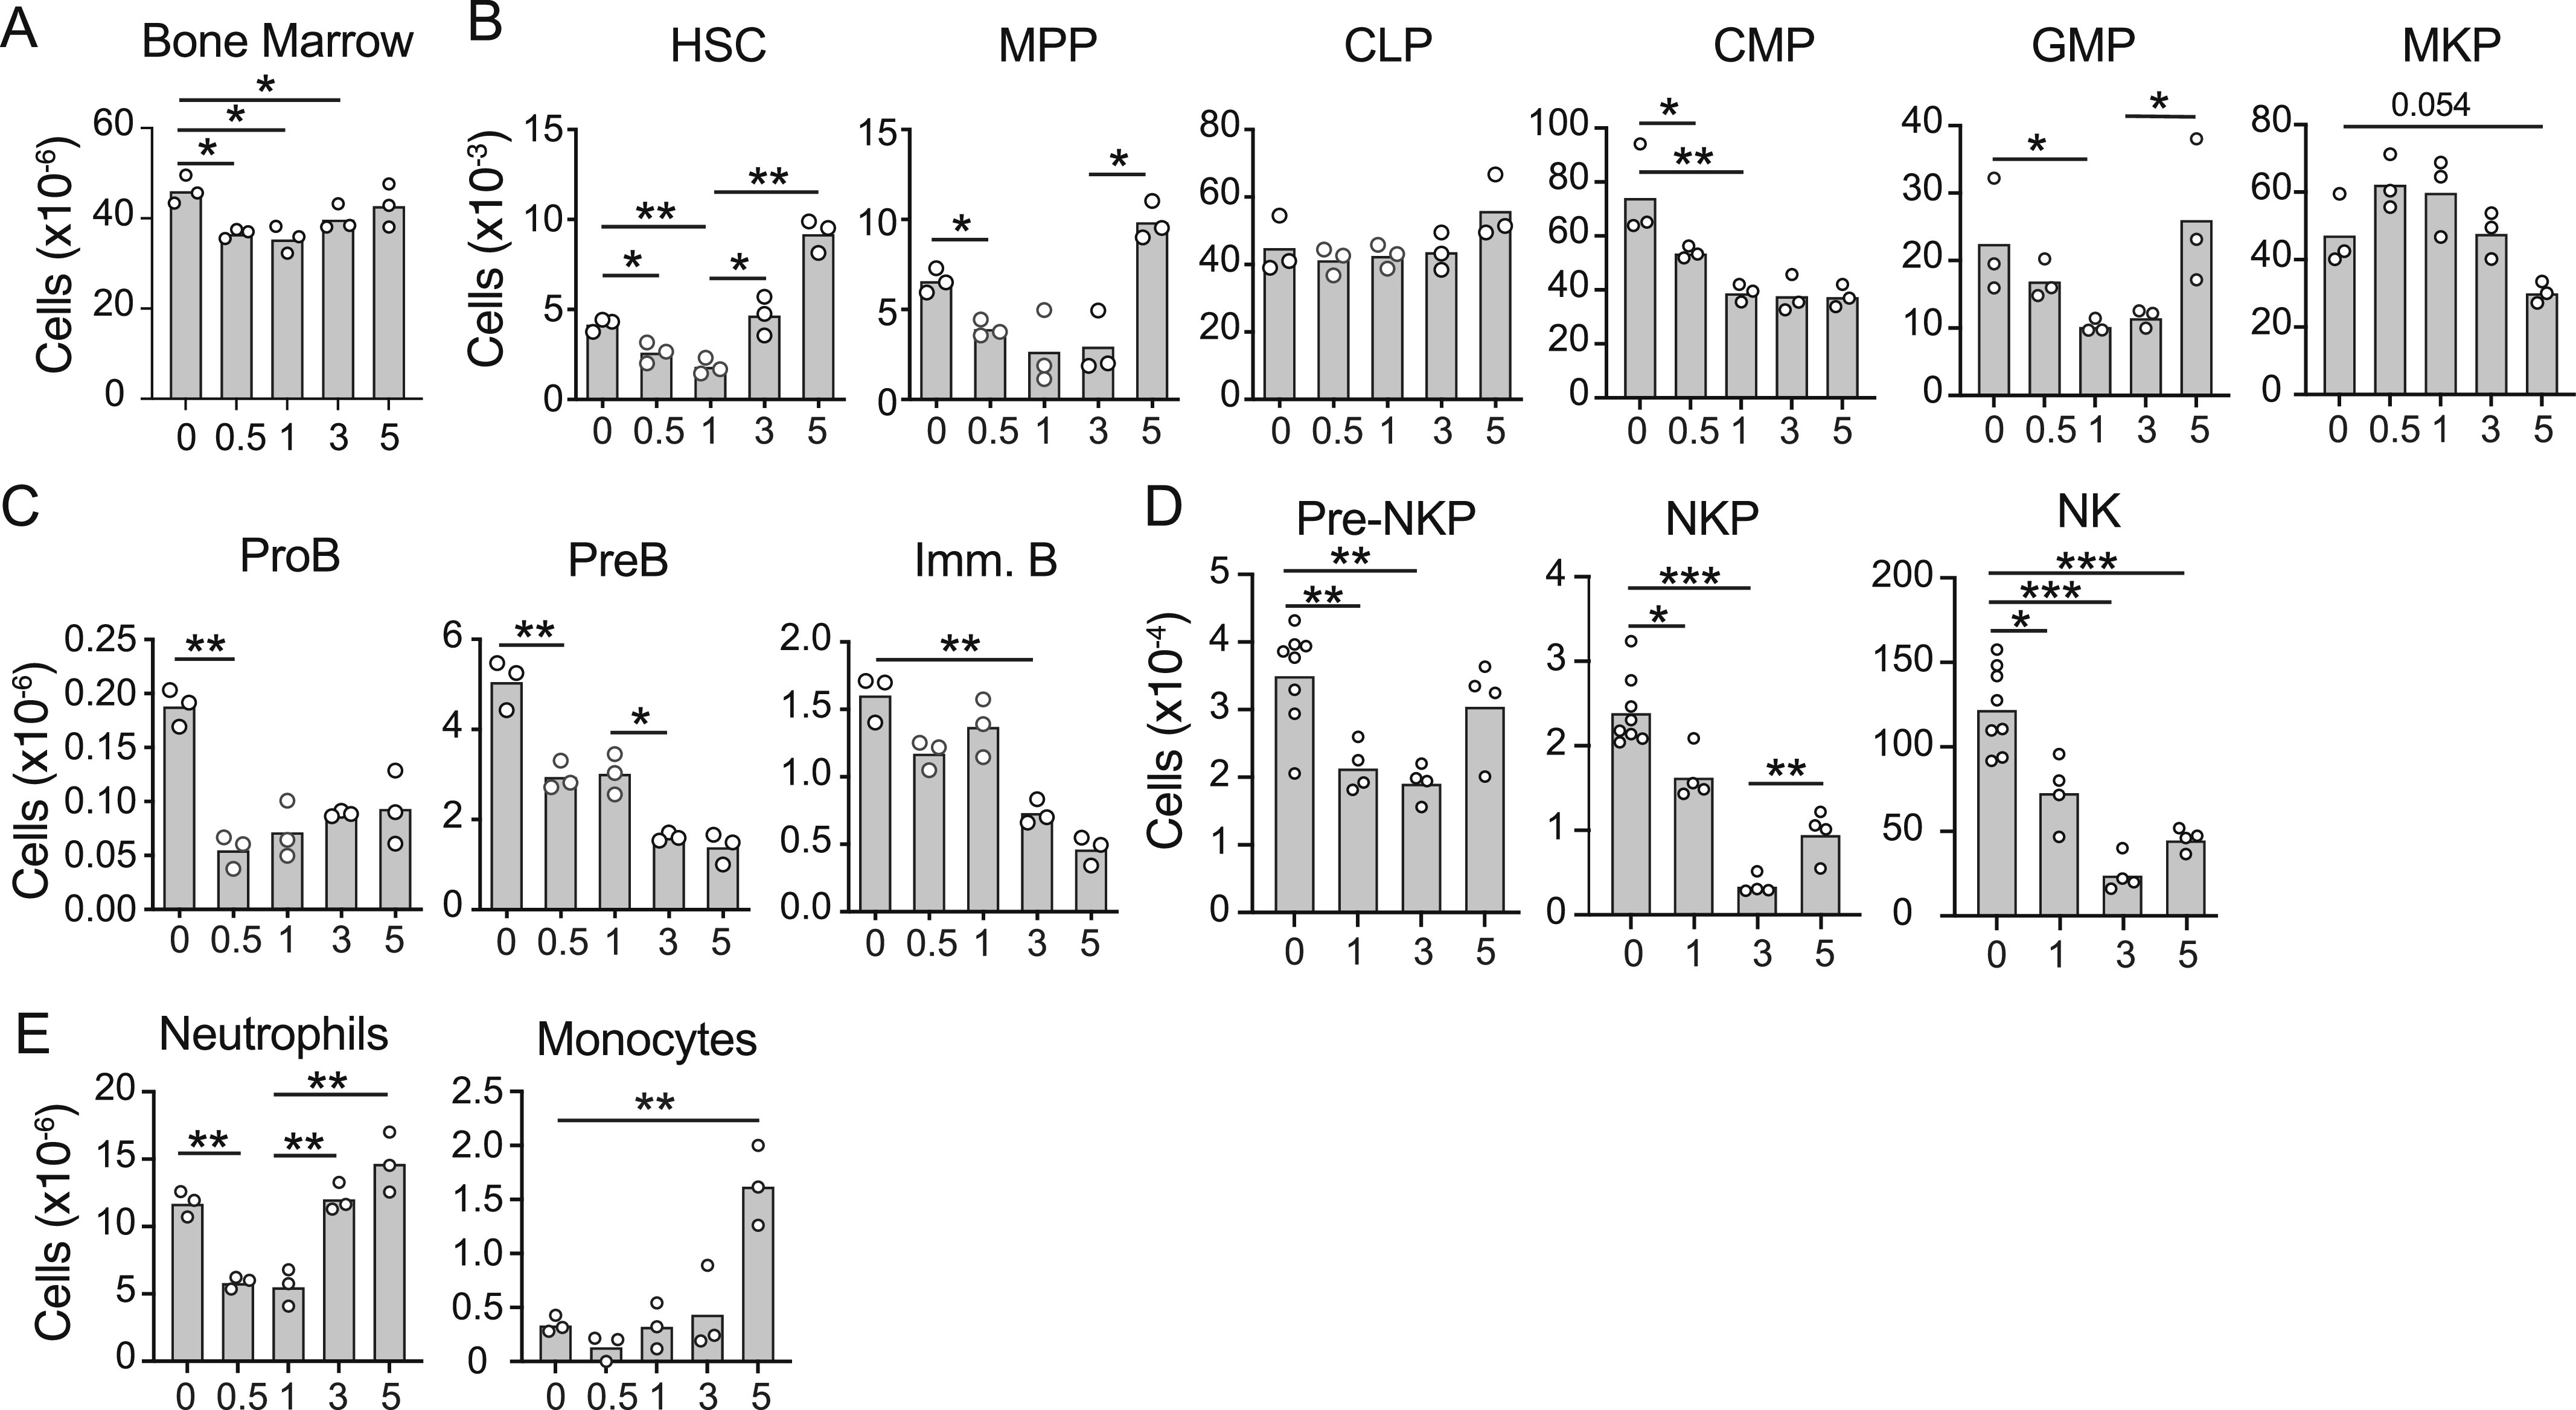
Figure 1. Effects of systemic inflammation on hematopoiesis.

(A) Total cell number in bone marrow from femur and tibia. (B) HSC, MPP, CLP, CMP, GMP, and MKP numbers in bone marrow. (C) ProB-, PreB-, and immature B-cell numbers in bone marrow. (D) pre-NKP, NKP, and NK cell numbers. (E) Bone marrow neutrophil and monocyte numbers in femur and tibia. Mice were administered CFA i.p. on day 0 and analyzed at the indicated time points (days, x-axis). Bars indicate the mean, and circles depict individual mice. *P < 0.05 and **P < 0.005 by a t test. Data are representative of three independent experiments.
