
Figure 3. LTβR signaling and TNF receptor signaling control IL-7 production and B lymphopoiesis.
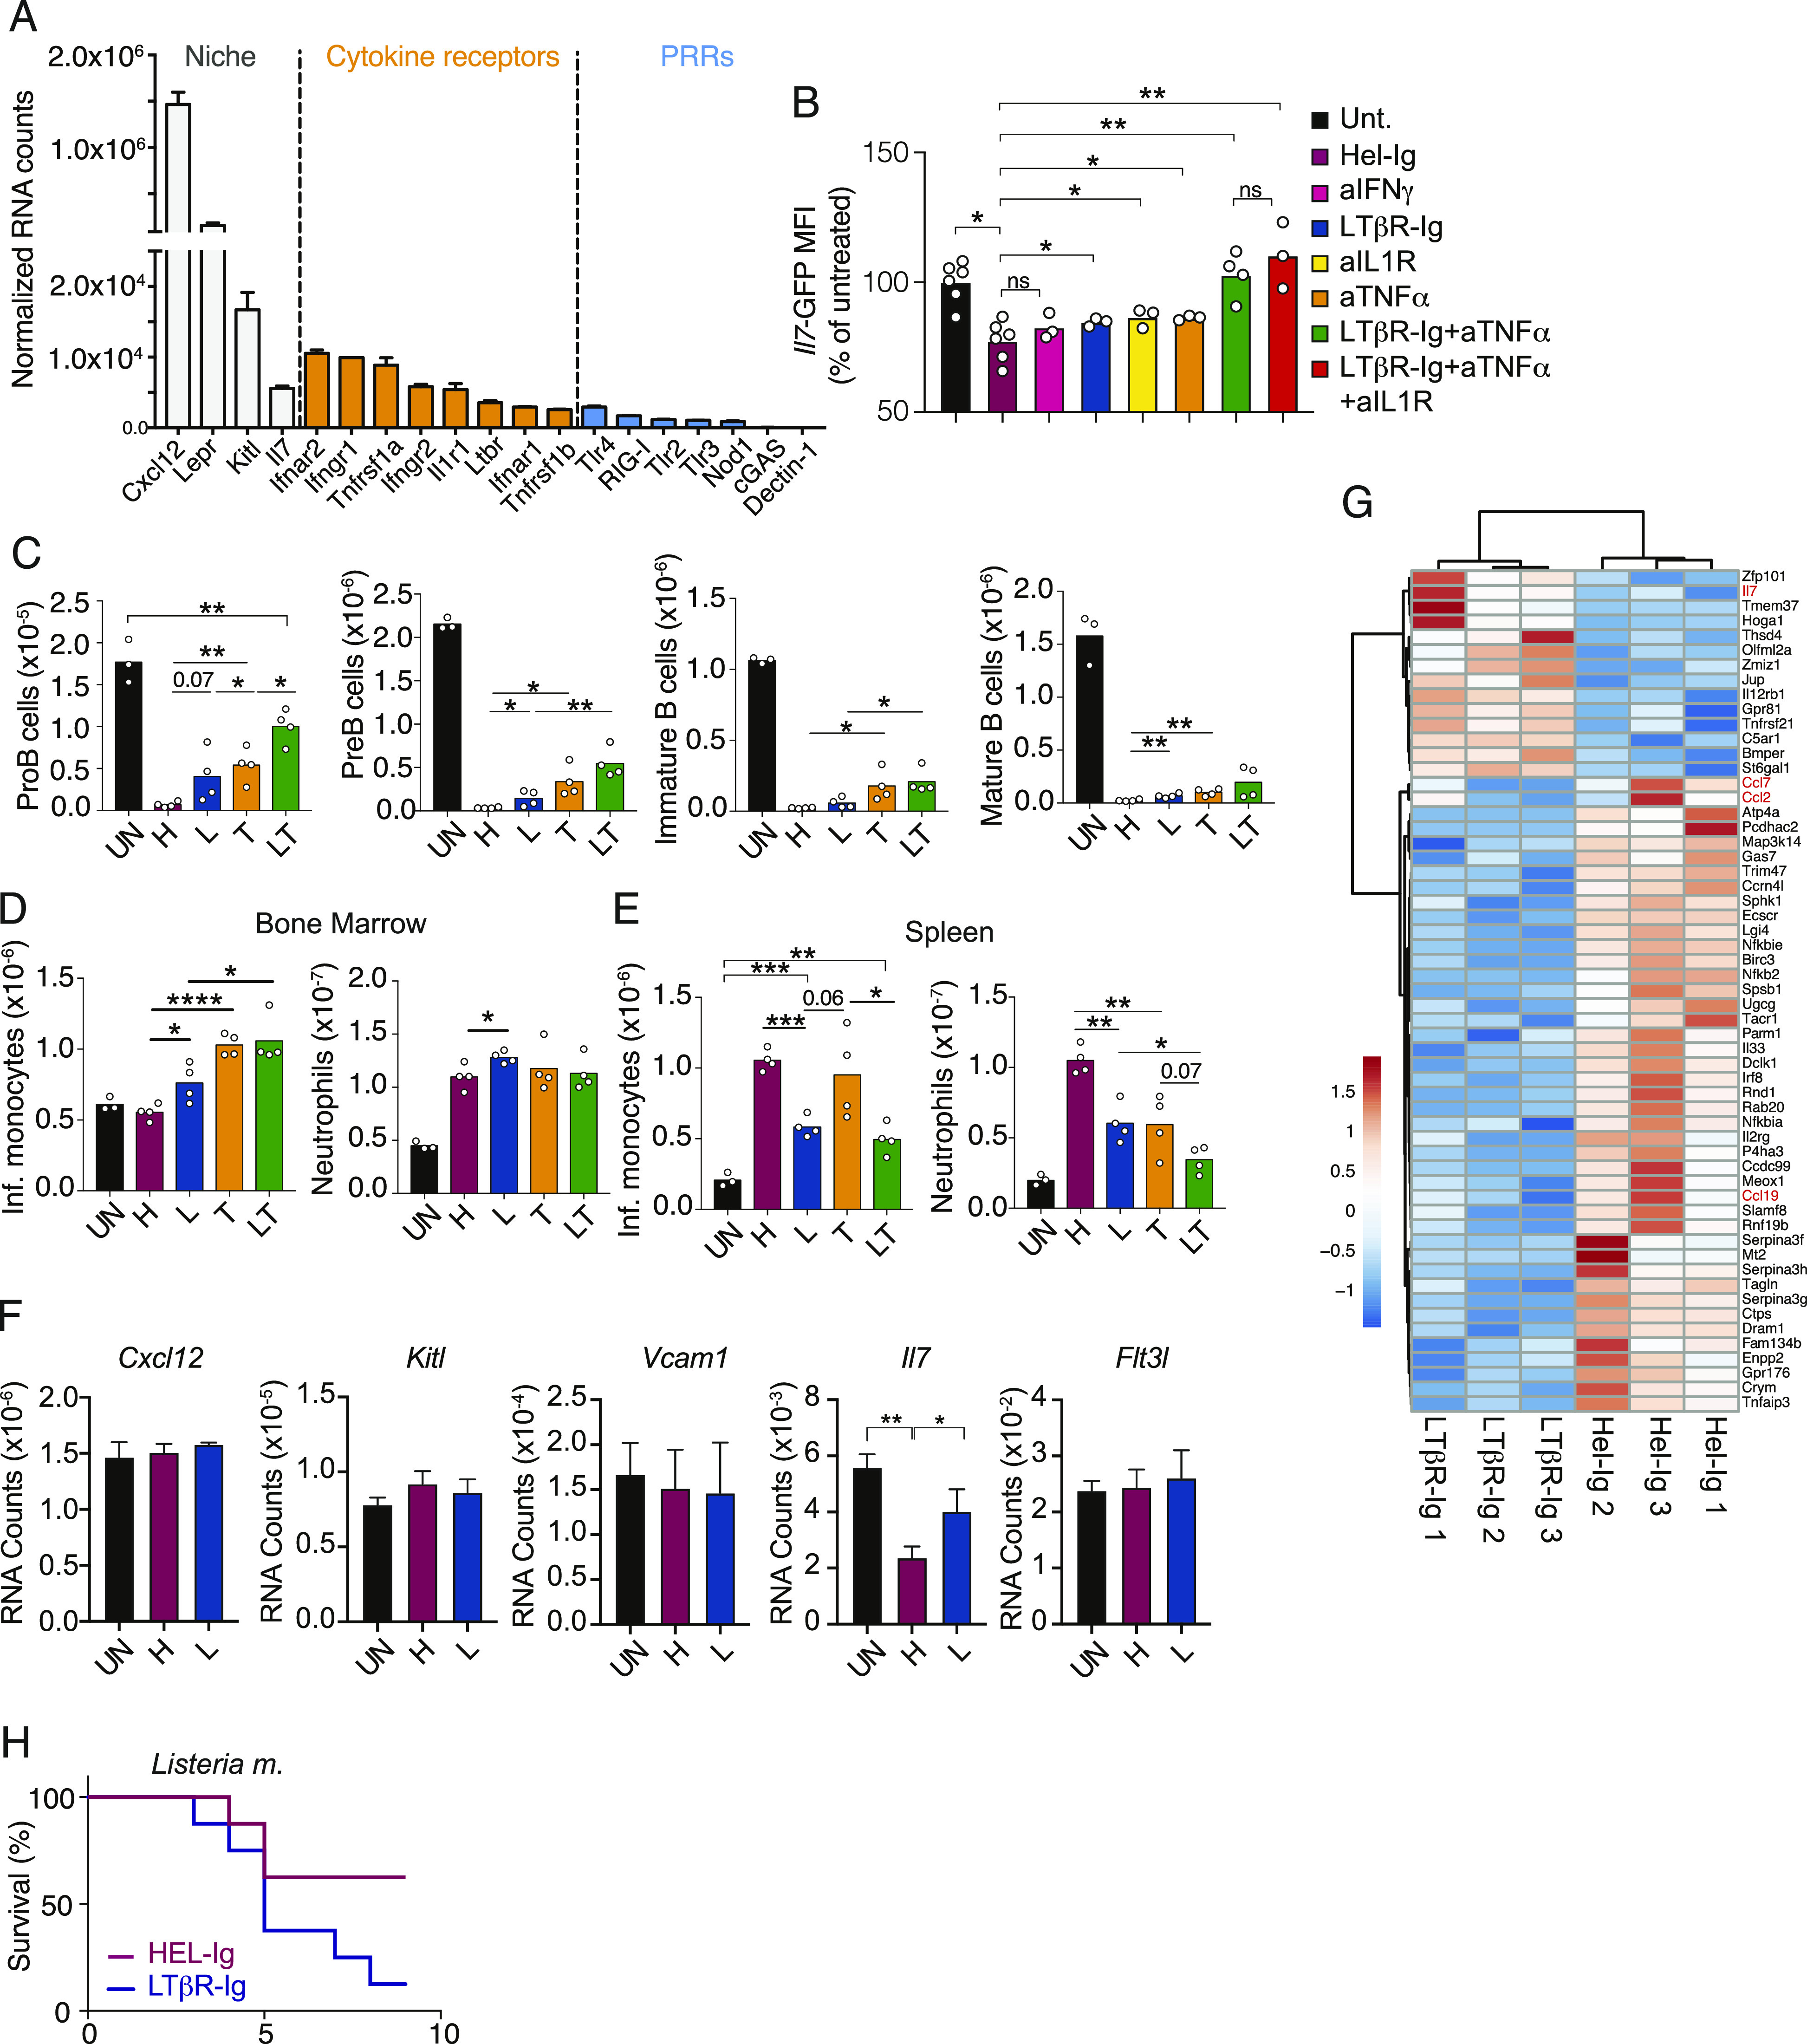
(A) Normalized RNA counts of cytokine and pattern recognition receptors in bone marrow MSCs; data obtained from MSC RNA sequencing. (B) Il7-GFP expression in gated bone marrow MSCs relative to untreated mice (expressed as percent of untreated). (C) Numbers of proB, preB, immature B, and mature B cells in bone marrow. (D, E) Numbers of inflammatory monocytes and neutrophils in bone marrow (D) and spleen (E). In panels (B, C, D, E), data were obtained from untreated control (UN, black) or CFA-immunized mice treated with HEL-Ig (H, wine red), LTβR-Ig (L, blue), anti-TNF-α (T, orange), and LTβR-Ig + anti-TNF-α (LT, green) for 5 d. (F) CFA-induced changes in lymphopoietic factors expressed by MSCs. (G) Differentially expressed genes in MSCs isolated from mice injected with CFA for 24 h and treated with LTβR-Ig (L) or HEL-Ig (H, FDR-adjusted q-value < 0.05). (H) Survival after i.v. infection with Listeria monocytogenes (50,000 CFU) after pretreatment with either HEL-Ig or LTβR-Ig (n = 8 per group). Data in panels (A, B, C, D, E) are representative of two to six experiments. Data in panels (F, G) were from one experiment. Bars represent the average, circles depict individual mice, and error bars indicate the SEM. *P < 0.05; **P < 0.005; ***P < 0.0005; and ****P < 0.00005 by an unpaired t test.