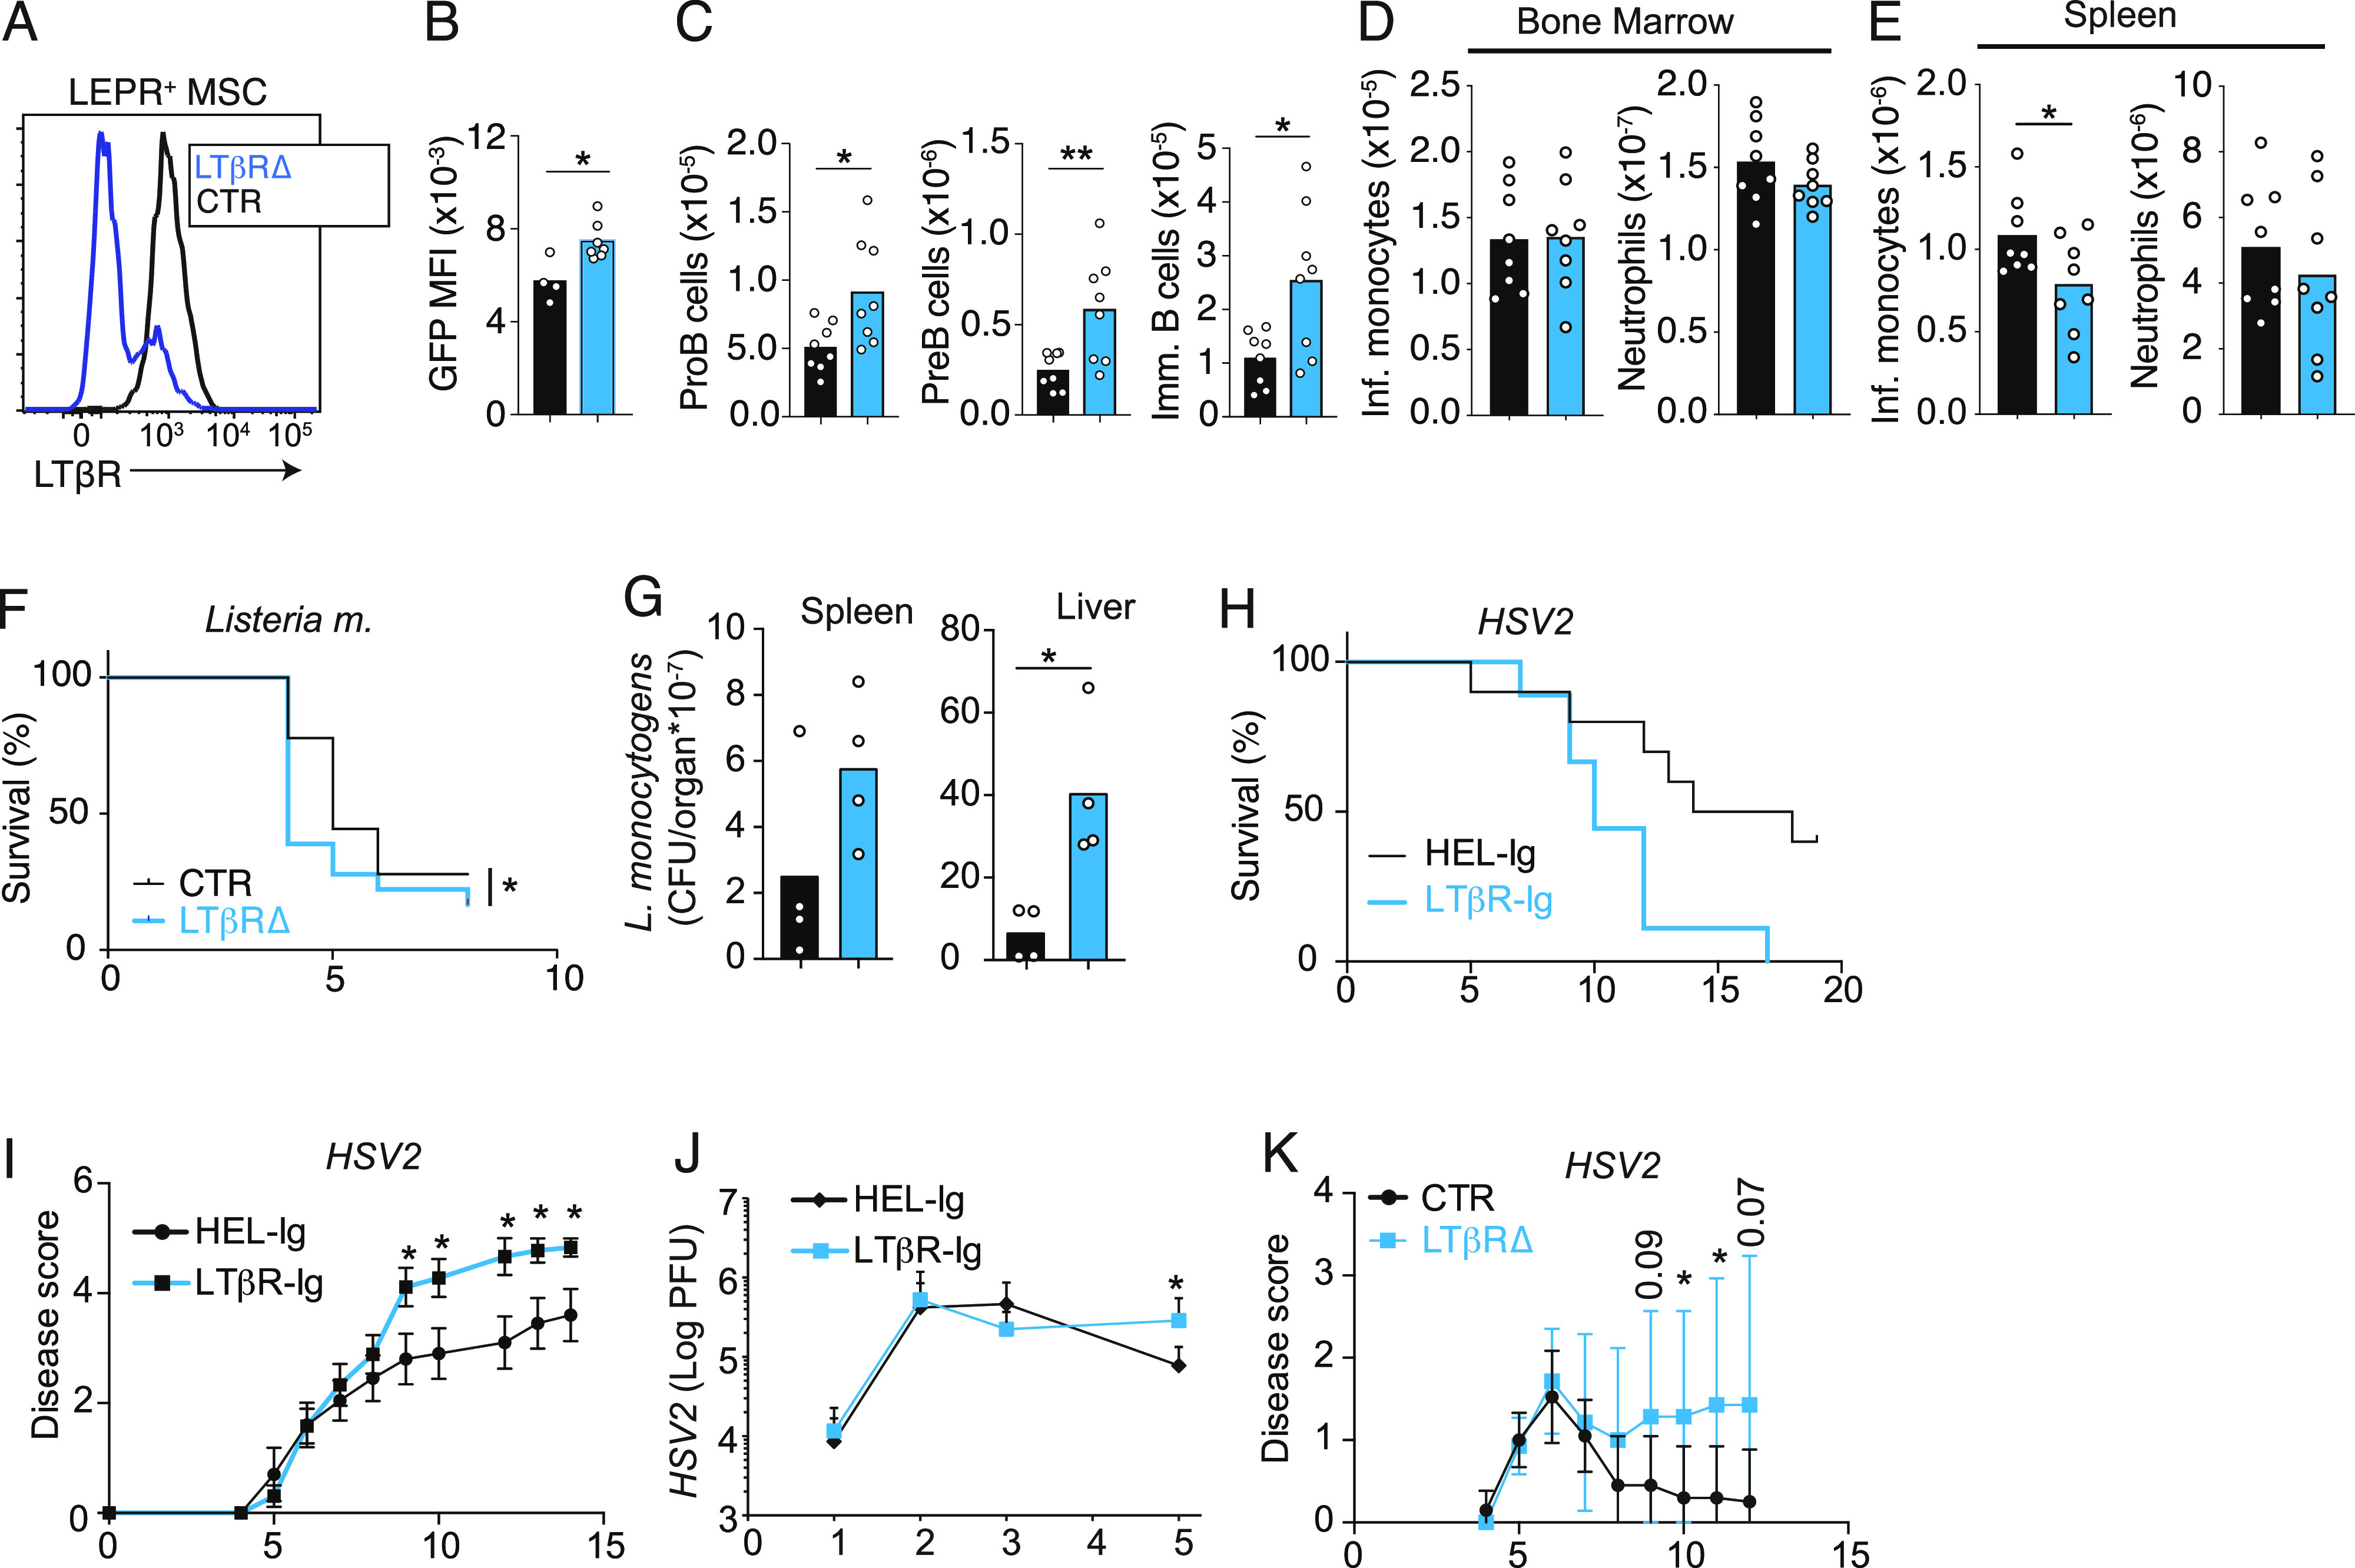
Figure 4. LTβR signaling in bone marrow MSCs controls emergency myelopoiesis.

(A) Histogram of LTβR expression on gated bone marrow Lepr+ MSCs from Lepr+/+; Ltbrfl/fl (CTR, black) and LeprCre/+; Ltbrfl/fl (blue, LTβR∆) mice. (B, C, D, E) Il7 expression in MSCs, (C) developing B-cell subsets in bone marrow, and (D, E) inflammatory monocytes and neutrophils in bone marrow (D) and in the spleen (E) of CTR (black) and of LTβR∆ (blue) mice immunized with CFA i.p. for 5 d. Bars represent the average, circles depict individual mice, and error bars indicate the SEM. (F) Survival of CTR (black, n = 9) and of LTβR∆ (blue, n = 11) mice after i.v. infection with Listeria monocytogenes (370,000 CFU). (G) Listeria monocytogenes CFUs in spleen and liver of CTR (black) and of LTβR∆ (blue) mice at day 3 post-infection. (H, I, J) Survival (H), disease score (I), and HSV-2 viral titers (J) in vaginal wash of mice infected with 1,000 PFU after pretreatment with either HEL-Ig (n = 8) or LTβR-Ig (n = 6). (K) Disease score of CTR (black) and of LTβR∆ (blue) mice infected with HSV2 (1,000 PFU) intravaginally. In panels (G, H, I, J), x-axis shows time post-infection (days). *P < 0.05 and **P < 0.005 by an unpaired t test. Data in panels (A, B, C, D, E, F) are representative of two to four experiments. Data in panels (G, H, I, J) were from one experiment. Bars represent the average, circles depict individual mice, and error bars indicate the SEM.
