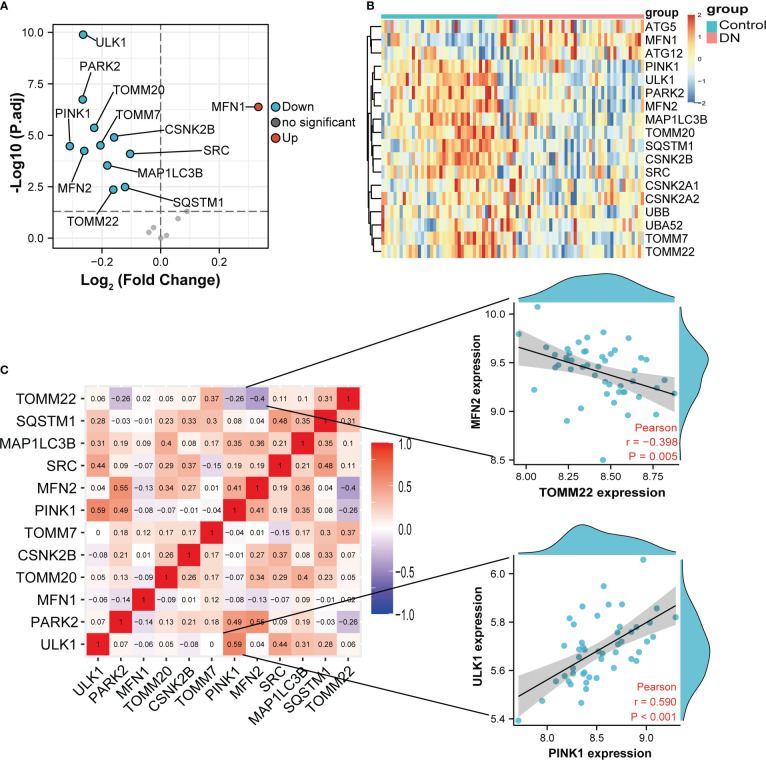
Figure 3.
Variance analysis of mitophagy-related genes in DN. (A) Volcano plot showing a summary of the expression differences of 18 mitophagy-related genes between the healthy and DN patients’ glomerular samples. (B) The clustering heatmap exhibited the expression pattern of DE-MRGs among glomeruli samples. (C) Correlations between DE-MRGs in DN glomeruli samples and the respective scatterplots show the two pairs of MRGs with the highest correlation. Correlation analysis was assessed using Pearson correlation.

