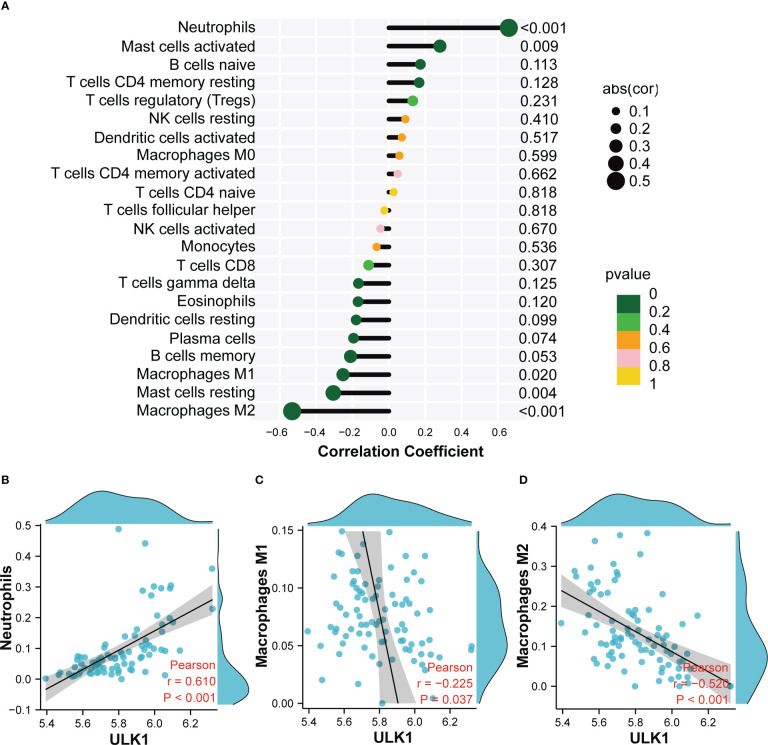
Figure 9.
Correlation analysis between ULK1 and infiltrating immune cells. (A) Correlation Analysis diagram showing the correlation between ULK1 and Infiltrating Immune Cells. (B) Scatter diagram indicating the correlation between ULK1 expression and Neutrophils. (C) Scatter diagram indicating the correlation between ULK1 expression and Macrophages M1. (D) Scatter diagram indicating the correlation between ULK1 expression and Macrophages M2. Correlation analysis was assessed using Pearson correlation.

