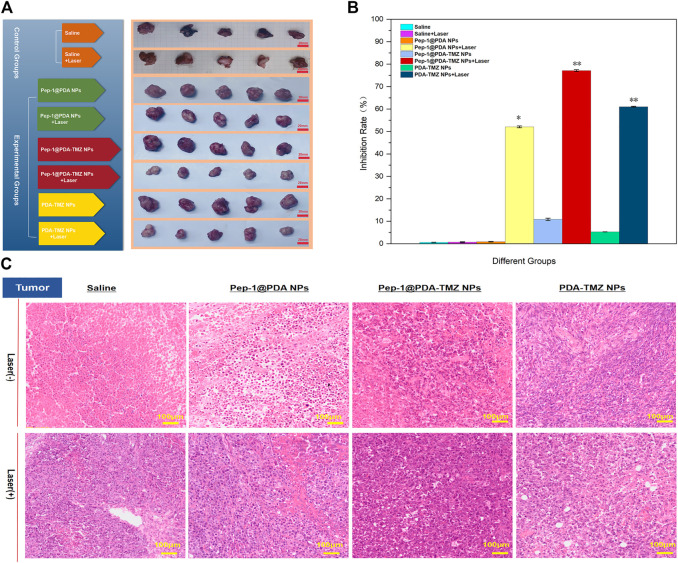
FIGURE 14.
(A) In vivo PTT combined with CT efficacy of the NPs. (B) The tumor inhibition by different groups of drugs. *p < 0.05,**p < 0.01; (C) The H&E images of tumor treated with the Saline, Pep-1@PDA NPs, Pep-1@PDA-TMZ NPs, and PDA-TMZ NPs at 24 h post irradiation (808 nm, 1 W/cm2, and 10 min).

