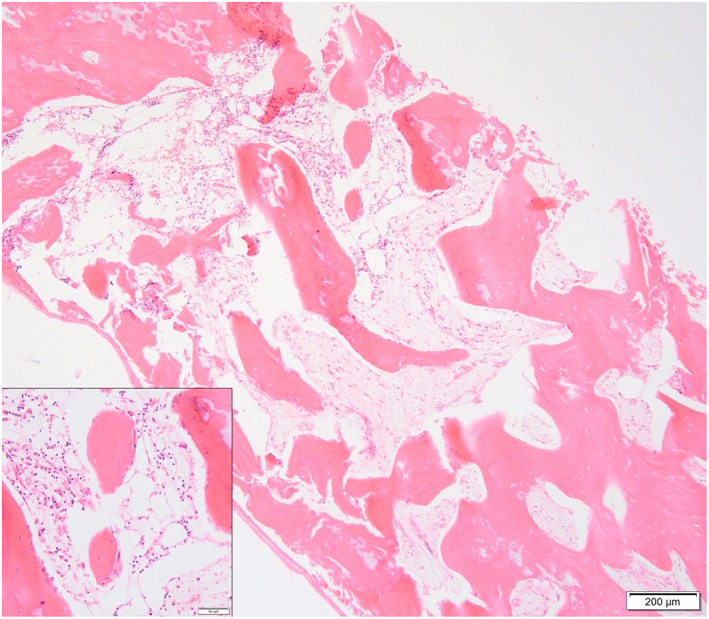
FIGURE 1.

Core section of feline bone marrow with marked generalized hypoplasia. H&E stain, 4× objective, bar 200 μm. Insert: Close up from an area with low numbers of remaining segmented cells (eosinophils mostly). H&E stain, 20× objective, bar 50 μm
