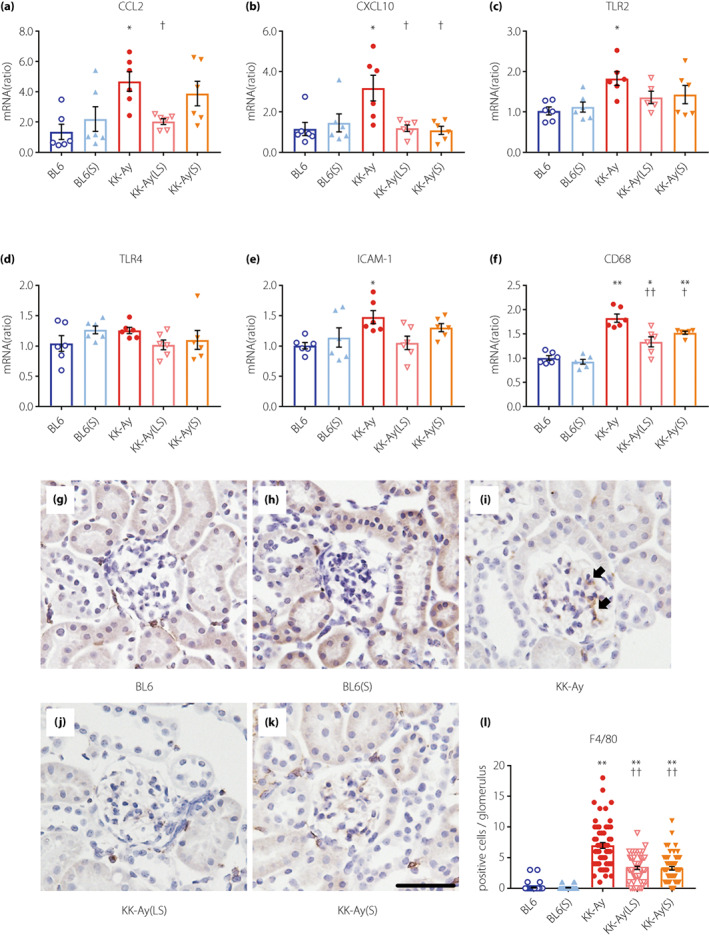
Figure 3.

Suramin treatment attenuates renal inflammation in KK‐Ay mice. (a–f) Quantification of CCL2 (a), CXCL10 (b), TLR2 (c), TLR4 (d), ICAM‐1 (e), and CD68 (f) mRNA expression in the renal cortex by real‐time RT‐PCR (n = 5–6). (g–k) Histological analysis of F4/80 in the glomeruli of BL6 (g), BL6(S) (h), KK‐Ay (i), KK‐Ay(LS) (j) and KK‐Ay(S) (k) mice. (l) Quantification of F4/80 positive cells in the glomerulus of 20 randomly selected glomeruli from each mouse (n = 3). Scale bar, 50 μm; original magnification, 200×. Arrows indicate F4/80‐positive cells. Data are presented as mean ± SEM. *P < 0.05, **P < 0.001 vs BL6 group. † P < 0.05, †† P < 0.001 vs KK‐Ay group. BL6(S), BL6 mice treated with a moderate‐dose of suramin; BL6, BL6 mice treated with saline; CCL2, C‐C motif chemokine 2; CXCL10, C‐X‐C motif chemokine ligand 10; ICAM‐1, intercellular adhesion molecule 1; KK‐Ay(LS), KK‐Ay mice treated with a low‐dose of suramin; KK‐Ay(S), KK‐Ay mice treated with a moderate‐dose of suramin; KK‐Ay, KK‐Ay mice treated with saline; TLR2, toll‐like receptor 2; TLR4, toll‐like receptor 4.
