
Figure 6.
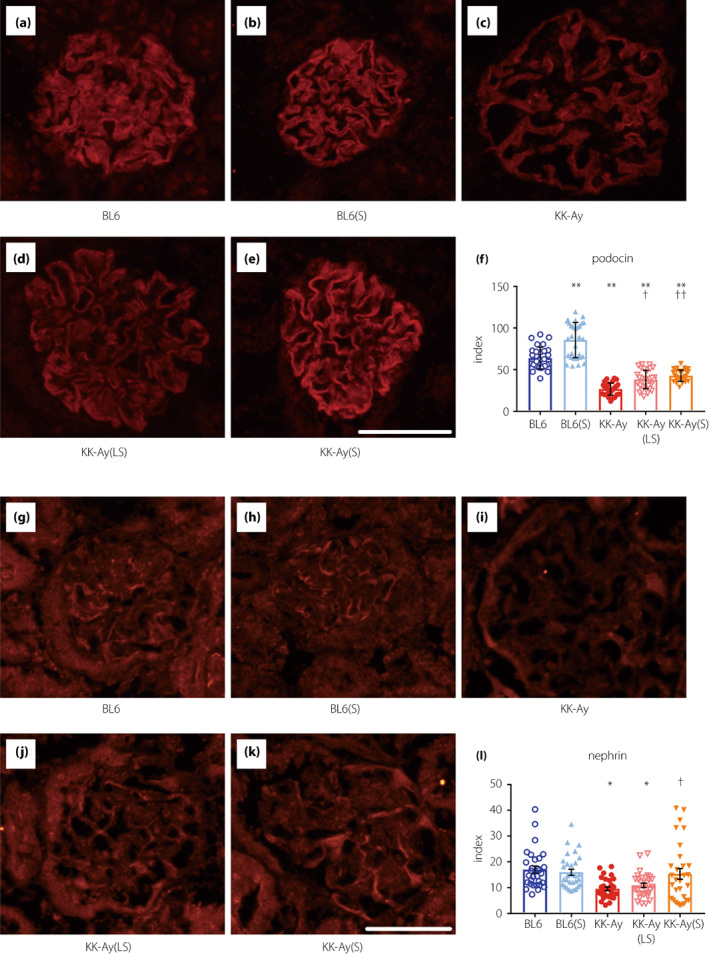
Effect of suramin on immunofluorescence staining for glomerular podocin and nephrin. (a–e) Histological expression of podocin in the glomeruli of BL6 (a), BL6(S) (b), KK‐Ay (c), KK‐Ay(LS) (d), and KK‐Ay(S) (e) mice. (f) Podocin expression was estimated using the fluorescence intensities of 10 randomly selected glomeruli from each mouse (n = 3). (g–k) Histological expression of nephrin in the glomeruli of BL6 (g), BL6(S) (h), KK‐Ay (i), KK‐Ay(LS) (j), and KK‐Ay(S) (k) mice. (l) Nephrin expression was estimated using the fluorescence intensities of 10 randomly selected glomeruli from each mouse (n = 3). Scale bar, 50 μm; original magnification, 200×. Data are presented as mean ± SEM. *P < 0.05, **P < 0.001 vs BL6 group. † P < 0.05, †† P < 0.001 vs KK‐Ay group. BL6(S), BL6 mice treated with a moderate‐dose of suramin; BL6, BL6 mice treated with saline; KK‐Ay(LS), KK‐Ay mice treated with a low‐dose of suramin; KK‐Ay(S), KK‐Ay mice treated with a moderate‐dose of suramin; KK‐Ay, KK‐Ay mice treated with saline.