
FIGURE 3.
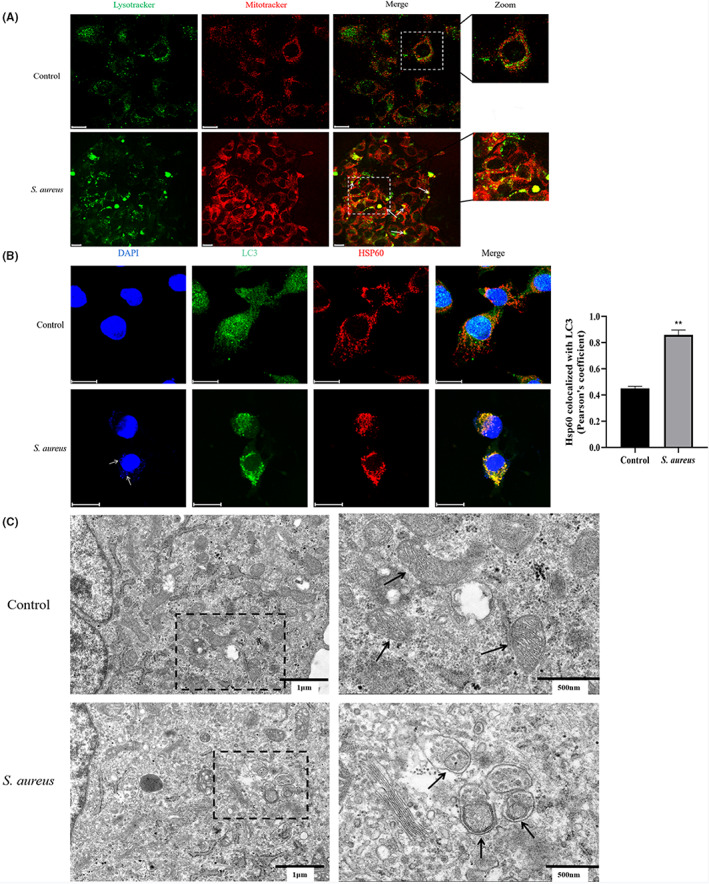
Mitophagy developing in S. aureus infected bovine macrophages. (A) Observation of colocalization of mitochondria (red) and lysosomes (green) under confocal microscopy. (B) Observation of colocalization of LC3 (green) and HSP60 (red) under confocal microscopy and quantitative statistics by Pearson's coefficient. White arrows point to S. aureus. (C) Observation of mitochondria engulfed by lysosomes under transmission electron microscopy. Black arrows point to mitochondria. Scale bar = 20 μm for A and B. The data are presented as the means ± SEM. Each experiment was repeated three times. Significance was identified by independent‐samples t test or one‐way anova and least significant difference test, and p < 0.05 was accepted as significant. **p < 0.01 vs. untreated control group