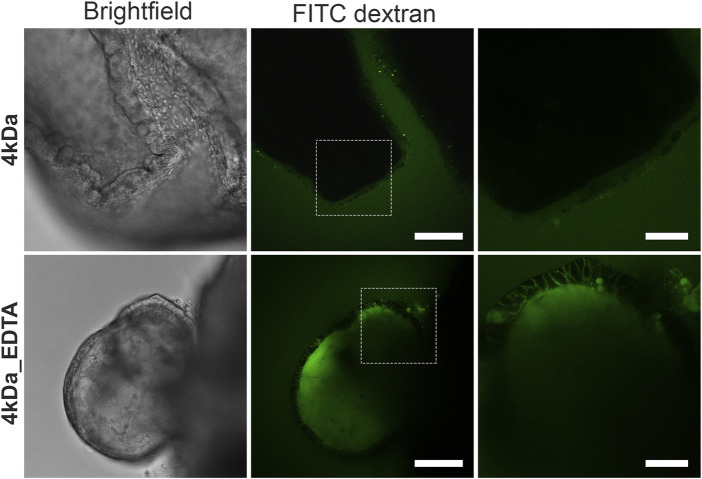
FIGURE 2.
Suspension intestinal organoids show epithelial barrier integrity by a FITC-dextran diffusion assay. Suspension organoids exclude the 4 kDa FITC-dextran, showing tight epithelial barrier formation (top row). When organoids are treated with 2 mM EDTA (bottom row), the barrier is disrupted and FITC-dextran diffuses into the intracellular space and the organoid lumen. White boxes in the middle images delineate the areas shown in the zoomed images to the respective right. Scale bars: 100 μm (left and middle) and 50 μm (right).

