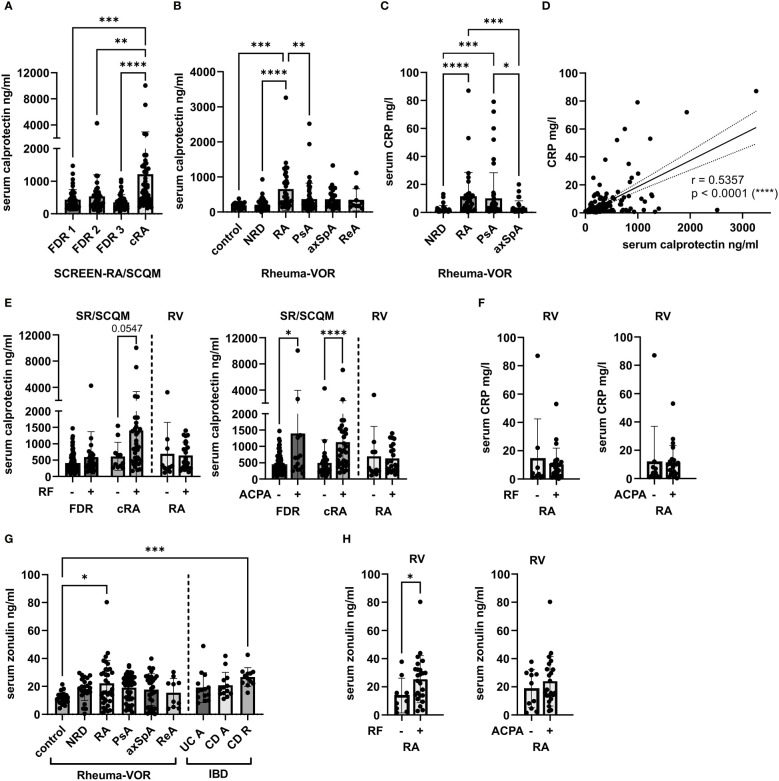
Figure 1.
Calprotectin and zonulin levels in the serum of individuals at risk of RA, new onset rheumatic patients and chronic RA patients. (A) Serum calprotectin levels in seronegative, symptom-free first-degree relatives (FDR 1, n=42), individuals with RA specific autoantibodies (FDR 2, n=40), individuals with RA specific symptoms (FDR 3, n=38) and chronic RA patients (cRA, n=45), recruited via the SCREEN-RA and SCQM cohort. (B) Serum calprotectin levels in healthy blood donors (BD, n=20), and patients newly diagnosed with non-rheumatic disease (NRD, n=35), rheumatoid arthritis (RA, n=33), psoriatic arthritis (PsA, n=50), axial spondyloarthritis (axSpA, n=30) and reactive arthritis (ReA, n=10), recruited via the Rheuma-VOR cohort. (C) Serum C-reactive protein (CRP) levels in NRD (n=34), RA (n=33), PsA (n=50) and axSpA (n=28) patients from the Rheuma-VOR cohort. (D) Spearman correlation between serum CRP and serum calprotectin measured in patients from the Rheuma-VOR cohort. (E) Serum calprotectin levels in FDR individuals and cRA patients from the SCREEN-RA/SCQM cohort and RA patients from the Rheuma-VOR cohort divided by RF and ACPA positivity. Statistical differences between positive and negative groups within patient groups were calculated using Mann-Whitney test. (F) Serum CRP levels in RA patients from the Rheuma-VOR cohort divided by RF and ACPA pre- and absence. Statistical differences between groups were calculated using Mann-Whitney test. (G) Serum zonulin levels in healthy blood donors (BD, n=20), patients newly diagnosed with non-rheumatic disease (NRD, n=22), rheumatoid arthritis (RA, n=33), psoriatic arthritis (PsA, n=48), axial spondyloarthritis (axSpA, n=30), reactive arthritis (ReA, n=10), as well as IBD patients with active ulcerative colitis (UC A, n=14), active Crohn’s disease (CD A, n=13), and Crohn’s disease under remission (CD R, n=12). Dots in the Rheuma-VOR groups depict single measurements, while dots in the IBD groups represent median values calculated from 2 replicates. (H) Serum zonulin in Rheuma-VOR RA patients clustered by RF and ACPA positivity. Statistical differences between groups were calculated using Mann-Whitney test. Data is shown as mean ± SD, *p < 0.05; **p < 0.01; ***p < 0.001; ****p < 0.0001; not significant if not further indicated.

