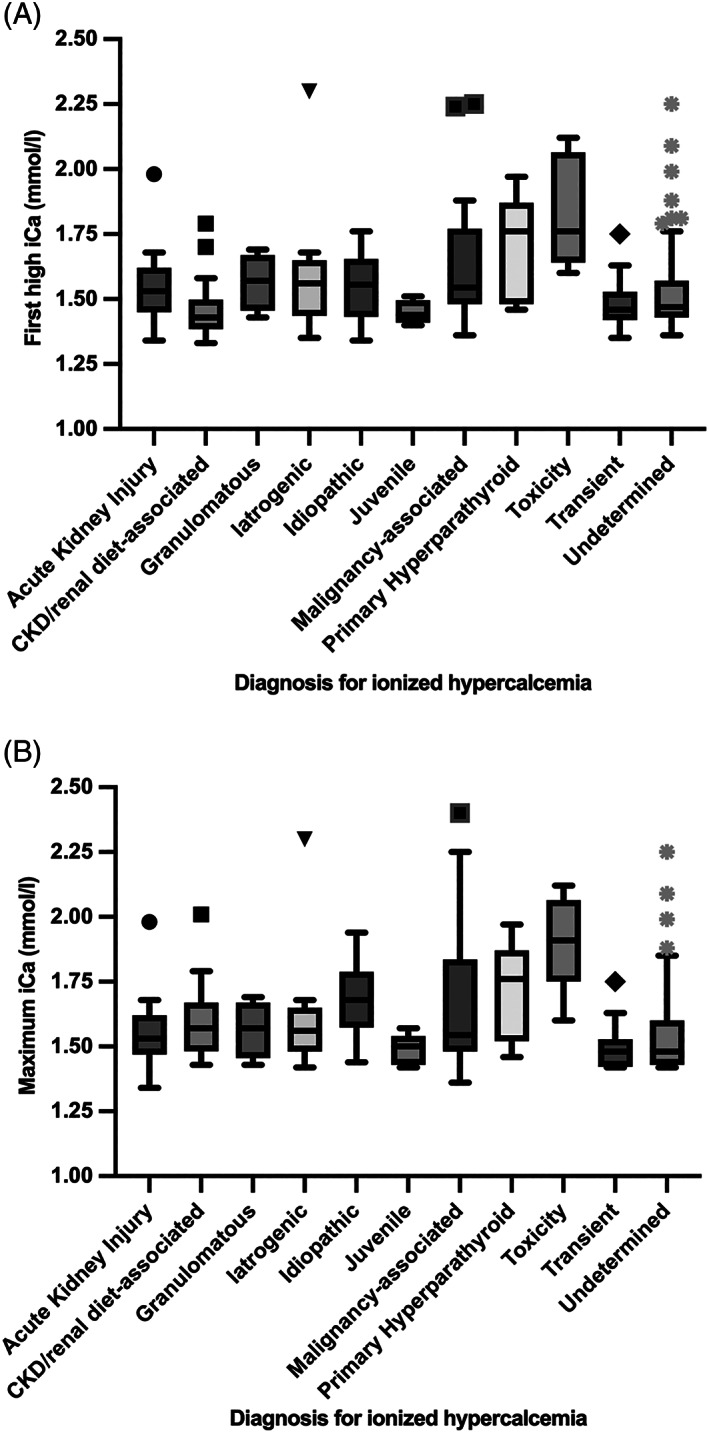
FIGURE 1.

Box and whisker plot (via the Tukey method) of the first high ionized calcium (A) and maximum ionized calcium (B) results from 238 cats with at least 1 ionized calcium >1.41 mmol/L, separated by final diagnosis. The box represents the 25th, median and 75th percentiles, the upper whisker represents the highest data point within 1.5× the interquartile range and the lower whisker represents the lowest data point within 1.5× the interquartile range. Any outliers are plotted individually. CKD, chronic kidney disease; iCa, ionized calcium
