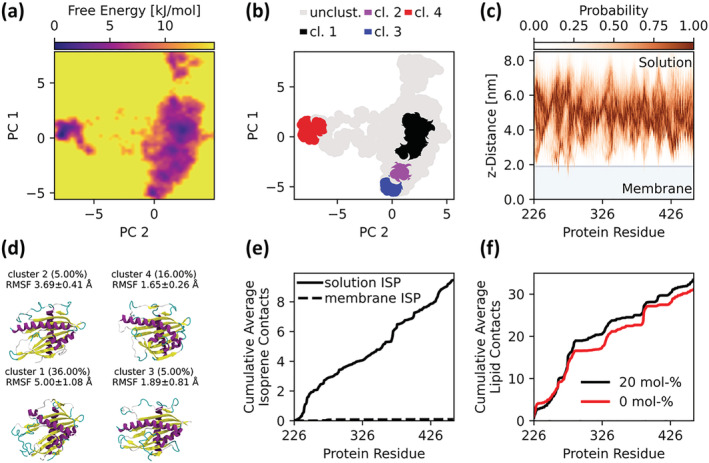
FIGURE 3.

(a) Folding free energy landscape projection from the replica exchange simulation along the first two principal components. Each point depicts a unique protein conformation. The coloration indicates the free energy from black, the free energy minimum, to yellow, unsampled high energy states. (b) Cluster analysis of the free energy landscape with (d) depicting representative structures, the probability seen from simulation to be within a given cluster, and the root‐mean‐square fluctuation (RMSF) for structures within the cluster. The cluster center conformations within Figure 3d are shown in cartoon representations colored by the secondary structure elements yellow β‐sheet, purple α‐helix, cyan turn, and white random coil. (c) HDG11 START domain residue penetration depth into the thylakoid membrane. The blue shaded area shows the membrane area defined as the area within the phosphate atoms of the lipid head groups, whereas the protein residue distances in relation to the membrane center are red‐shaded histograms. Dark red regions demonstrate the highest likelihood to find protein residues at the respective distance from the membrane center. (e) Contacts between HDG11 START domain protein residues and isoprene molecules averaged over the trajectory frames. The graph differentiates between isoprene in solid line aqueous solution and dashed line inside the membrane. (f) The same as Figure 3e but for the contacts between protein residues and lipids in thylakoid membranes containing 0 mol% (red) and 20 mol% (black) isoprene.
