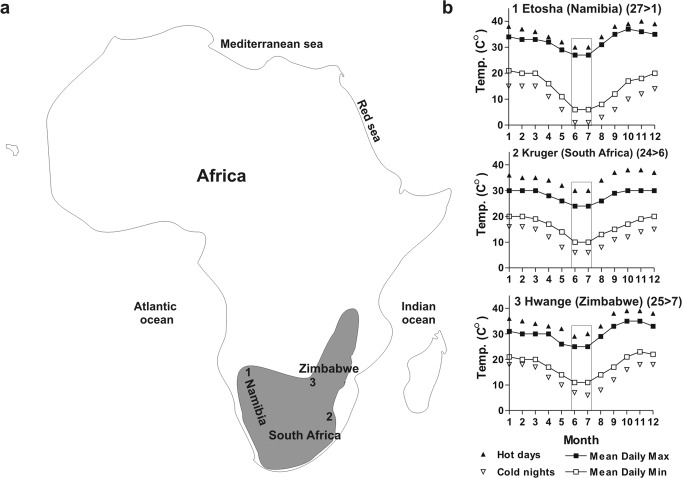
Fig. 1. Monthly temperature variation in the approximate natural habitat of Xenopus laevis in Southern Africa.
a Map of Africa indicating approximately the native range of Xenopus laevis (modified from Furman et al., 2015) and three natural parks (numbers) located in this region. b Mean temperature data taken from the indicated natural parks including warm [hot days (filled triangles) and mean daily maximum (filled squares)] and cold conditions [cold nights (empty triangles) and mean daily minimum (empty squares)]. The mean temperature variation in June and July was used to devise a cooling paradigm (24 °C to 6 °C) that mimics the temperatures experienced by Xenopus in their native environment during the coldest months of winter (rectangle).

