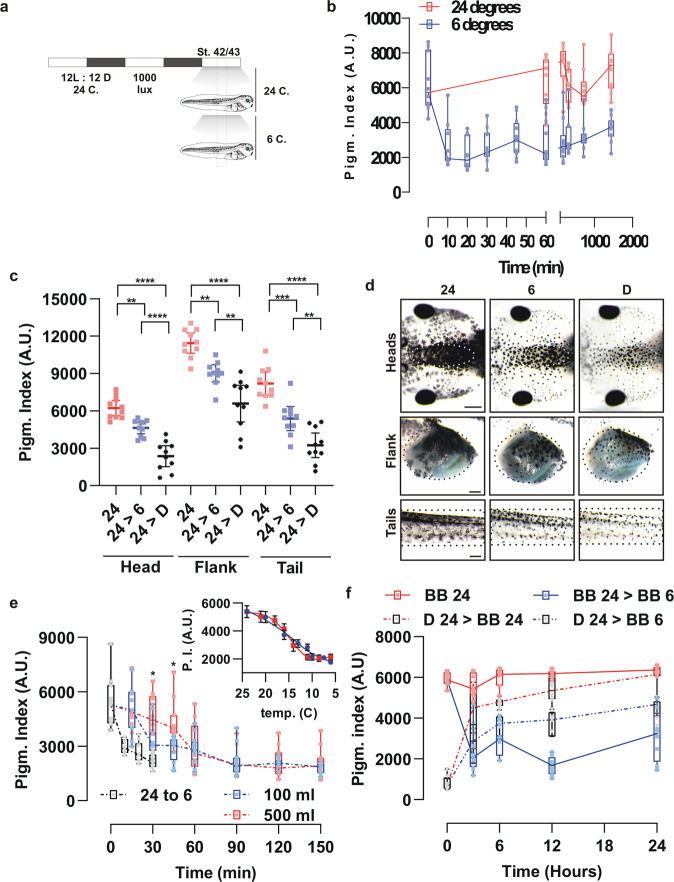
Fig. 2. Colour change induced by cooling is a systemic response mediated by a fast and temperature-dependent movement of melanosomes in skin melanophores.
a Schematic representation of the experimental approach. Embryos were raised on a 12 h ON/12 h OFF cycle until stage 42/43 with light shining from above (1000 lux). Embryos were maintained at 24 °C for at least two days prior to reaching stage 42/43. Analysis of the effect of temperature on skin pigmentation was performed at approximately the middle of the light phase cycle (rectangle), by switching to bathing media at 6 °C, while keeping constant the overhead light and surface colour. b Pigmentation index quantified from digital images of the dorsal head of Xenopus embryos at different times after being moved from 24 °C (red dots and lines) to 6 °C degrees (blue dots and lines) [individual data points (n = 9 embryos) and a box plot (25th to 75th percentile) are represented; N = 3 independent experiments]. c, d Comparative pigmentation index (c) and pictures (d) of the dorsal head, lateral belly (flank) and the tail of tadpoles at 24 °C (red dots) or 6 °C (blue dots), or switched to dark (black dots) conditions at 24 °C (D; dark) for 30 min (horizontal bar represented the mean ± 95% CI; n = 10 embryos; N = 3 independent experiments). Scale bar = 0.2 mm. e Head pigmentation index of tadpoles in 100 ml (blue dots and dashed line) or 500 ml (red dots and dashed line) containers at 24 °C moved to a 6 °C incubator. The solution temperature was monitored over time and is plotted vs. the pigmentation index (P.I.); blue: 100 ml; red: 500 ml; (Insert). Tadpoles switched from a 24 to 6 °C solution, as shown in 2 A, are also indicated (24 to 6; black dots and dashed line) [individual data points (n = 10 embryos) and box plot (25th to 75th percentile); N = 3 independent experiments]. f Temperature response (24 °C -red- to 6 -blue- °C) over time as quantified by the head pigmentation index of tadpoles previously adapted to either a black background (BB; solid lines) (darker embryos; melanosome dispersed) or dark conditions (D; dashed lines) (lighter embryos; melanosome aggregated). [individual data points (n = 8 embryos) and box plot (25th to 75th percentile); N = 2 independent experiments); **p < 0.01, ***p < 0.001; ****p < 0.0001; ANOVA followed by Bonferroni’s test. *p < 0.05 t-test.

