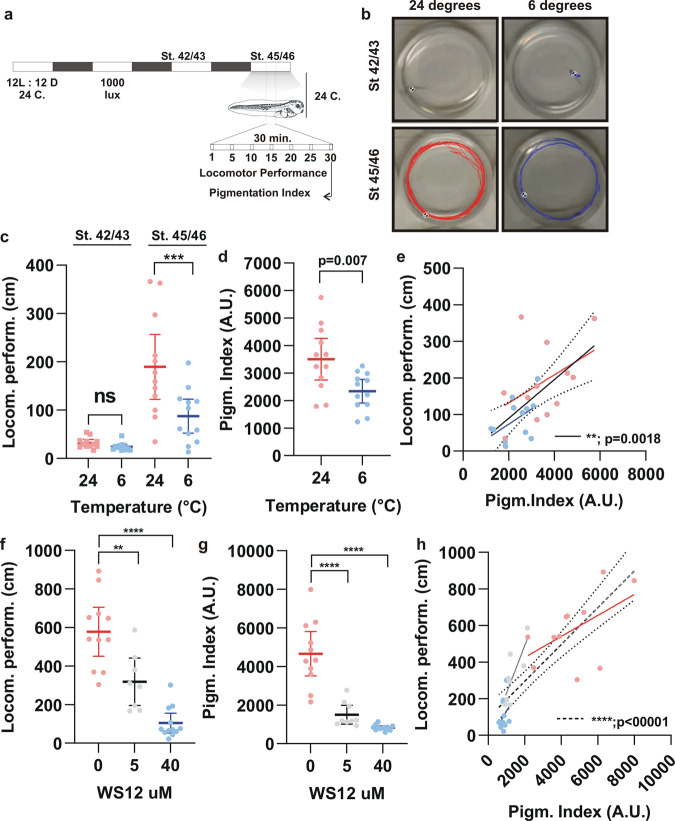
Fig. 5. Skin pigmentation and locomotor performance.
a Schematic representation of the experimental approach. The locomotor performance was analyzed for stage 45/46 embryos by recording swim activity (1 min) every 5 min for 30 min. The pigmentation index of each tadpole was determined at the end of the study. b A representative analysis of the locomotor performance determined by tracking the distance swum at 24 °C (red) and 6 °C (blue). c, f Locomotor performance of embryos at 24 °C (red dots) or at 6 °C (blue dots) (c) or at 24 °C in the presence of WS12 (without WS12: red dots; 5 µM: grey dots; 40 µM: blue dots) (f). d, g Pigmentation index of stage 45/46 embryos at 24 °C or at 6 °C (d) or at 24 °C in the presence of WS12 (g). e, h Correlation between locomotor performance and the pigmentation index. The linear regression for each treatment is indicated with a red (24 °C) or blue (6 °C) solid line. Dotted lines represent the 95% confidence interval while the dashed line is the Pearson correlation coefficient (two-tail) from all data. **p < 0.01, ***p < 0.001; ****p < 0.0001; ANOVA followed by Bonferroni’s test or Student’s t-test in d. Each dot represents the measurement for one tadpole, and the bar is the mean with 95% confidence interval; n = 8 embryos; N = 2 independent experiments.

