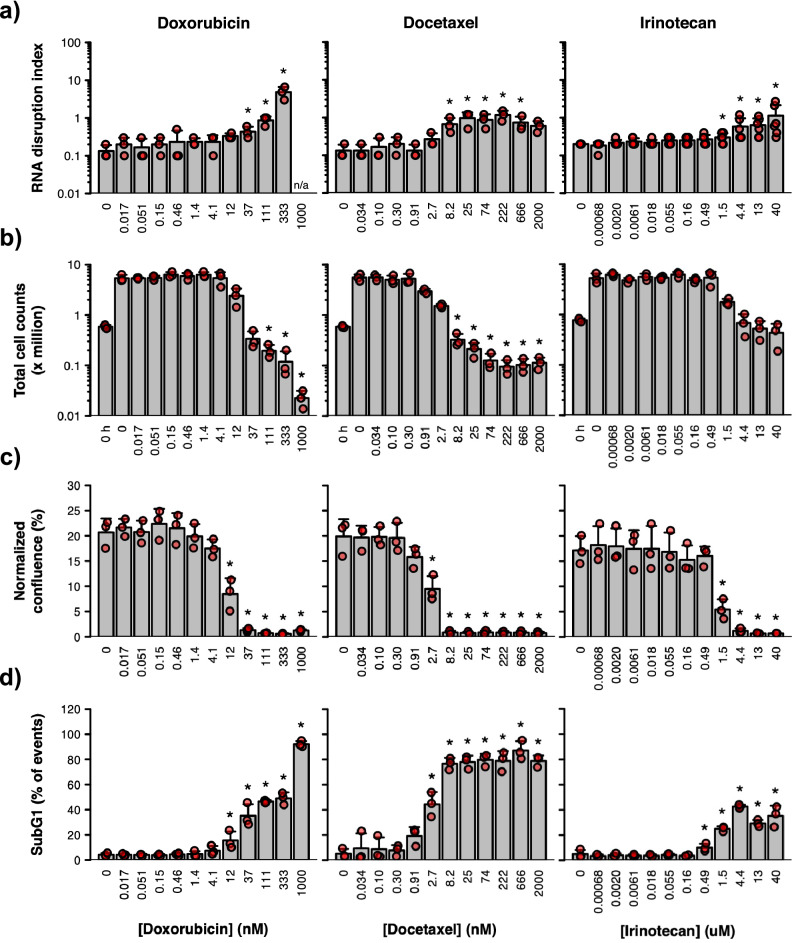
Figure 4.
Effect of three chemotherapy agents on cell viability/death and RNA integrity. A2780 cells were treated with different concentrations of doxorubicin (left panels), docetaxel (middle panels) or irinotecan (right panels) for 72 h. (a) RNA disruption assay. Total RNA was isolated from cells, and RNA disruption was quantified using the RDA. (b) Cell counting assay. Total cells were counted using a haemocytometer following drug treatment. Untreated cells were counted prior to treatment (‘0 h’) to provide a baseline count. (c) Recovery assay. Drug-treated cells were collected, washed, resuspended in a drug-free medium and seeded into plates. After 96 h, the culture’s confluence was measured and normalized to its confluence at 2 h post-seeding. (d) DNA content analysis. Drug-treated cells were collected, washed, fixed, and stained with propidium iodide then analyzed by flow cytometry. Data are presented as means ± standard deviation, with individual data points shown in red. Groups labelled with an asterisk were significantly greater (panels a and d) or significantly lower (panels b and c) than the ‘0 h’ (panel b) or untreated (panels a, c and d) control. See Supplementary Table S3 for detailed results of each statistical test. n/a, extensive RNA disruption in the sample precluded RDA analysis.

