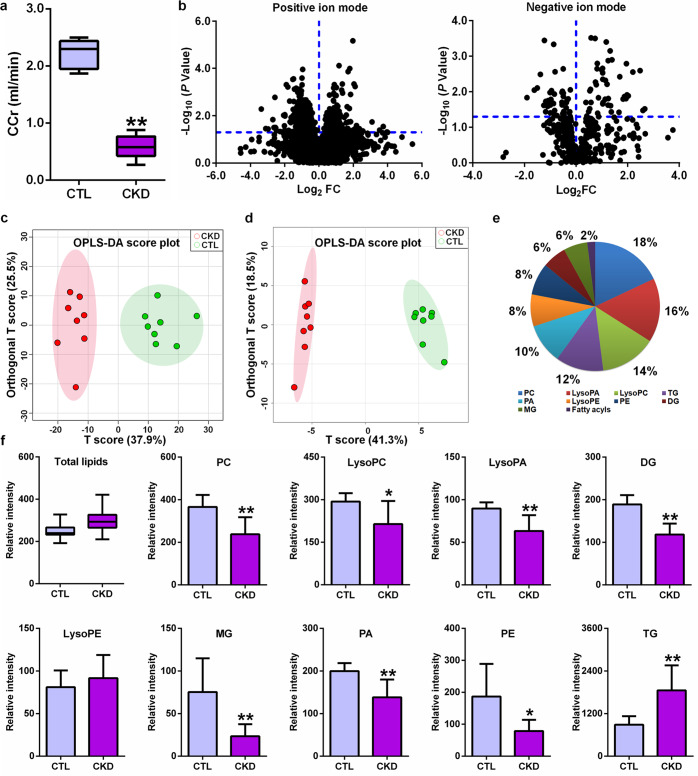
Fig. 1. Adenine leads to renal function decline and altered lipid profiles in CKD rats.
a Creatinine clearance rate in control and CKD rats induced by adenine. b The geometric mean ratio of each variable in CKD rats versus control rats is presented in positive and negative ion modes. c OPLS-DA of 710 variables with P < 0.05 by using two-tailed unpaired Student’s t test between two groups in positive electrospray ionization mode. d OPLS-DA of 89 variables with P < 0.05 by using two-tailed unpaired Student’s t test between two groups in negative electrospray ionization mode. e Dendrogram analysis based on 50 lipid species identified in positive and negative ion modes. f The levels of total lipids and intraclass comparison of the distribution of 50 lipid species. *P < 0.05, **P < 0.01 compared with CKD rats.

