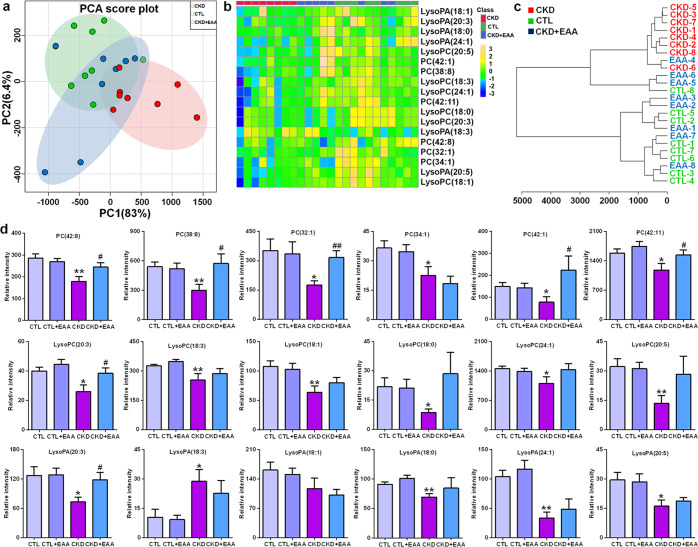
Fig. 6. Treatment with EAA improves PC metabolism in CKD rats induced by adenine.
a PCA of 18 lipid species, including 6 PCs, 6 LysoPCs and 6 LysoPAs, in control, CKD and CKD+EAA (200 mg/kg) rats. b Heatmap clustering analysis based on 18 lipid species, including 6 PCs, 6 LysoPCs and 6 LysoPAs, in control, CKD and CKD+EAA (200 mg/kg) rats. c Dendrogram of hierarchical clustering analysis based on 18 lipid species, including 6 PCs, 6 LysoPCs and 6 LysoPAs, in control, CKD and CKD+EAA (200 mg/kg) rats. d The levels of 18 lipid species, including 6 PCs, 6 LysoPCs and 6 LysoPAs, in the different rats. *P < 0.05, **P < 0.01 compared with control rats; #P < 0.05, ##P < 0.01 compared with CKD rats

