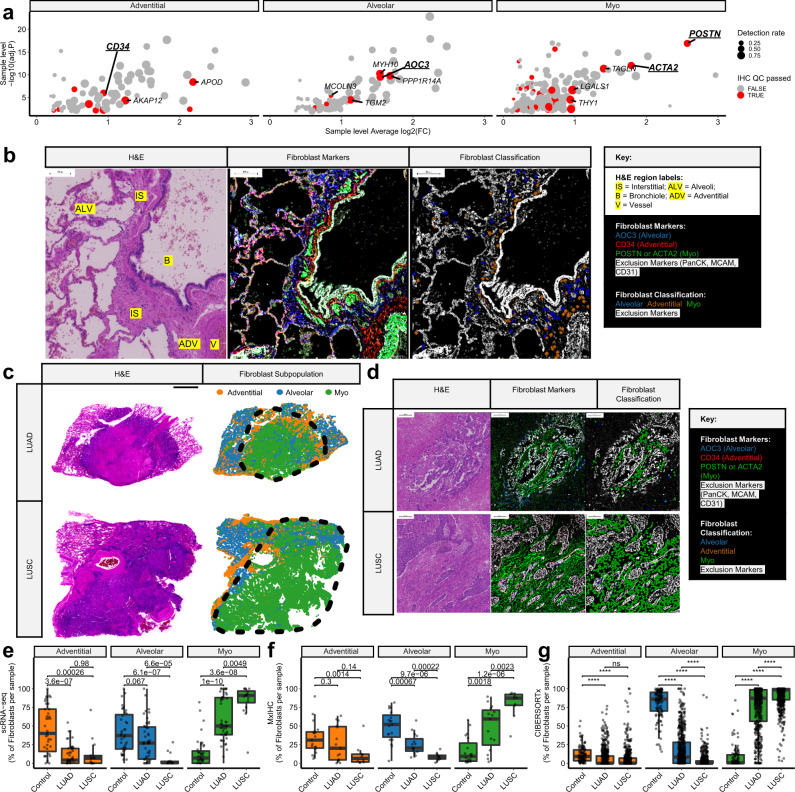
Fig. 3. Multiplexed IHC (mxIHC) and digital cytometry show that fibroblast subpopulations occupy spatially discrete niches and varied NSCLC tissue subtype enrichment.
a Scatter plot showing differential expression statistics (Bonferroni adj.P and log2 fold change) for putative subpopulation markers, highlighting those compatible for use in mxIHC analysis. Full details are provided in Supplementary Data 2. b Representative micrographs from H&E staining and multiplexed IHC (mxIHC) performed on serial sections (n = 19 samples analysed). The micrographs (from left to right) represent H&E staining (notable regions are highlighted as described in the key), a pseudocoloured image depicting different markers identified by mxIHC (coloured as indicated in the key) and the results from histo-cytometry-based cell classification (with simulated cells coloured as indicated in the key). The region presented represents histologically normal lung tissue, including adventitial, alveolar, peri-bronchial and interstitial regions. Scale bars represent 100 µm. For further images showing region of interest selection and individual marker staining profiles please see Supplementary Data 6. c Representative examples from whole slide mxIHC analysis of NSCLC tissue sections (n = 15 [LUAD], 10 [LUSC] samples analysed). Panels showing serial section H&E staining and a point pattern plot showing the spatial distribution of different fibroblast populations (measured by histo-cytometry analysis of mxIHC). The scale bar represents 4 mm and the black dotted line demarcates the tumour region in each tissue section. For details of the full cohort analysed, please see Supplementary Data 7, 8. d As per b, presenting regions of the respective LUAD and LUSC cases shown in panel c. For further images showing region of interest selection and individual marker staining profiles please see Supplementary Data 9, 10 for the LUAD and LUSC case respectively. e Boxplot showing the relative abundance of each fibroblast subpopulation in different NSCLC subtypes, as measured in the integrated scRNA-seq dataset. Nominal p values for the Wilcoxon signed-ranks test are also shown (n = 39 [Control], 46 [LUAD], 16 [LUSC]). f As per d, measured by mxIHC, analysing pathologist annotated tumour regions for LUAD or LUSC and non-neoplastic regions within the tissue blocks as controls. Nominal p values for the Wilcoxon signed-ranks test are also shown (n = 19 [Control], 15 [LUAD], 10 [LUSC]). g As per c, as measured by CIBERSORTx-mediated digital cytometry. nsp > 0.05, ****p < 2.22e-16, Wilcoxon signed-ranks test (n = 110 [Control], 515 [LUAD], 501 [LUSC])24,25. All statistical tests carried out were two-sided and boxplots are displayed using the Tukey method (centre line, median; box limits, upper and lower quartiles; whiskers, last point within a 1.5x interquartile range). Source data for panels e–g are provided in the Source Data file.

