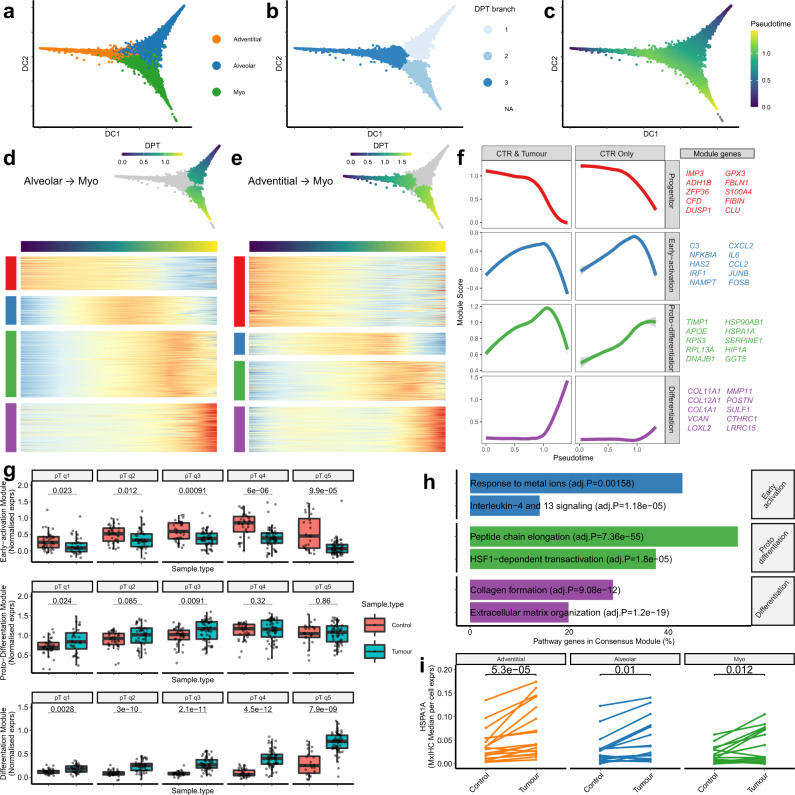
Fig. 4. Trajectory inference identifies consensus gene modules associated with the transdifferentiation from alveolar or adventitial fibroblasts to myofibroblasts.
a 2D visualisation (diffusion map dimensionality reduction) of the integrated fibroblast scRNA-seq dataset, highlighting the three subpopulations. b As per a, highlighting cells assigned to each diffusion pseudotime (DPT) branch. c As per a, showing the relative position of each cell in DPT. d Heatmap showing genes differentially expressed as alveolar fibroblasts progress to myofibroblasts in DPT. Hierarchical clustering was used to group these genes into modules defined by the DPT expression profile. Complete differential expression results are provided in Supplementary Data 12. e As per d, genes differentially expressed as adventitial fibroblasts progress to myofibroblasts. Complete differential expression results are provided in Supplementary Data 12. f Loss curve plots showing the expression profiles for each consensus DPT module in datasets consisting of control and tumour samples or only control tissue samples. Consensus modules consist of genes assigned to the same cluster in both alveolar to myo and adventitial to myo trajectories, ten representative genes for each module are listed (full gene lists can be found in Supplementary Data 12 and individual dataset plots are shown in Supplementary Fig. 4b). g Boxplots showing the expression of consensus DPT modules in cells grouped by tissue type and pseudotime quintiles. Nominal p values for the Wilcoxon signed-ranks test are also shown (n Control/Tumour = 37/32 [q1], 36/45 [q2], 36/55 [q3], 34/58 [q4], 24/58 [q5]). h Barplots showing REACTOME pathway enrichment results for each consensus DPT module (Benjamini–Hochberg adjusted P values are also shown). Full results provided in Supplementary Data 13. i Line plots showing the average HSPA1A expression levels between paired tumour and adjacent normal tissues for each fibroblast subpopulation, measured by mxIHC. Wilcoxon signed-ranks test (n = 18). All statistical tests carried out were two-sided and boxplots are displayed using the Tukey method (centre line, median; box limits, upper and lower quartiles; whiskers, last point within a 1.5x interquartile range). Source data for panels g, i are provided in the Source Data file.

