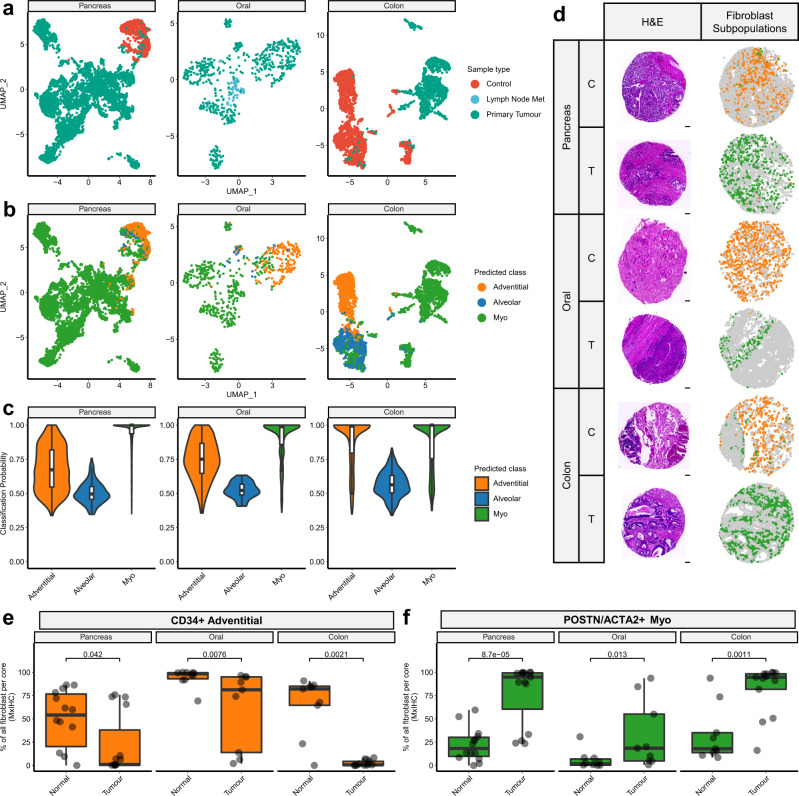
Fig. 5. Machine learning-based classification of scRNA-seq data and mxIHC shows adventitial and myofibroblasts are conserved across pancreatic, colorectal and oral cancers, whereas alveolar fibroblasts are lung-specific.
a 2D visualisation (UMAP dimensionality reduction) of fibroblasts isolated from different cancer types and analysed by scRNA-seq, highlighting the sample type. b As per a, highlighting the fibroblast subpopulation associated with each cell as predicted by a machine learning classifier. c Violin plots showing the probability of the machine learning classifier model’s predictions grouped by subpopulation (n = 6875 [Pancreas], 611 [Oral] and 3297 [Colon] fibroblast transcriptomes). d Representative images from mxIHC analysis of tissue microarrays (TMAs), constructed from pancreatic, oral and colon cancer tissue blocks (n cores analysed Control/Tumour = 14/15 [Pancreas], 10/9 [Oral], 9/13 [Colon]). Showing H&E staining and the spatial distribution of fibroblast subpopulations (measured by histo-cytometry analysis of mxIHC data). The scale bar represents 100 µm. Further images of individual staining profiles are provided in Supplementary Fig. 5a. e Boxplot showing the relative abundance of adventitial fibroblasts in tumour or control tissues, measured by mxIHC analysis of TMA cores. Nominal p values for the Wilcoxon signed-ranks test are also shown (n Control/Tumour = 14/15 [Pancreas], 10/9 [Oral], 9/13 [Colon]). f As per e, for myofibroblast abundance. All statistical tests carried out were two-sided and boxplots are displayed using the Tukey method (centre line, median; box limits, upper and lower quartiles; whiskers, last point within a 1.5x interquartile range). Source data for panels e, f are provided in the Source Data file.

