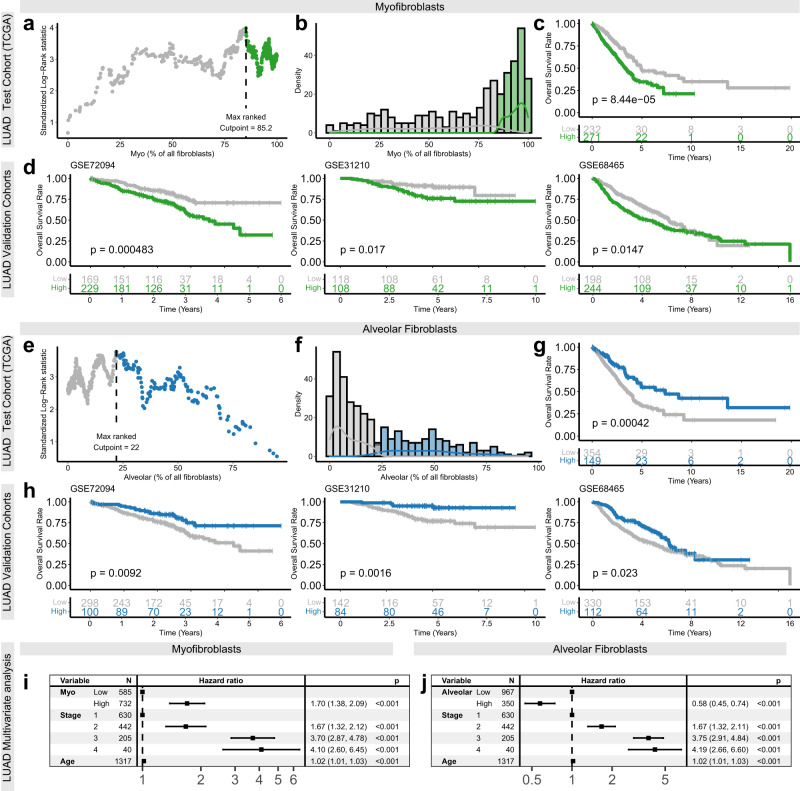
Fig. 6. CIBERSORTx-mediated digital cytometry shows that myofibroblasts and alveolar fibroblasts correlate with overall survival rates in LUAD.
a Scatter plot showing the variation in standardised log-rank survival statistics (correlation with overall survival rates) using different cut-points for dichotomising TCGA-LUAD25 samples by myofibroblast abundance. b Density plot showing the distribution of myofibroblast abundance measurements across TCGA-LUAD25 samples. c Kaplan–Meier plot showing TCGA-LUAD25 cohort patient survival rates, stratified by myofibroblast abundance using the optimal cut-point for dichotomisation (identified in a). Statistical significance was assessed using a log-rank test (n = 503). d Kaplan–Meier plots showing the cutpoint defined on TCGA-LUAD cohort (identified in panel a) applied to three additional LUAD validation cohorts. Statistical significance was assessed using Log-rank tests (n = 398 [GSE7209451], 226 [GSE3121052], 422 [GSE6846553]). e Scatter plot showing the variation in standardised log-rank survival statistic (correlation with overall survival rates) using different cut-points for dichotomising TCGA-LUAD25 samples by alveolar fibroblast abundance. f Density plot showing the distribution of alveolar fibroblast abundance measurements across TCGA-LUAD25 samples. g Kaplan–Meier plot showing TCGA-LUAD25 cohort patient survival rates, stratified by alveolar fibroblast abundance using the optimal cut-point for dichotomisation (identified in e). Statistical significance was assessed using a Log-rank test (n = 503). h Kaplan–Meier plots showing the cutpoint defined on TCGA-LUAD cohort (identified in panel a) applied to three additional LUAD validation cohorts. Statistical significance was assessed using Log-rank tests (n = 398 [GSE7209451], 226 [GSE3121052], 422 [GSE6846553]). i Forest plot showing covariate independent hazard ratios (±95% confidence intervals) and adjusted p values from multivariate Cox regression analysis of four-year overall survival rates across all LUAD patient cohorts analysed above, using myofibroblast abundance, disease stage and patient age as independent variables (exact p values provided in Source Data file). Results for individual datasets are shown in Supplementary Fig. 6c. j Forest plot showing covariate independent hazard ratios (±95% confidence intervals) and adjusted p values from multivariate Cox regression analysis of 4-year overall survival rates across all LUAD patient cohorts analysed above, using alveolar abundance, disease stage and patient age as independent variables (exact p values provided in Source Data file). Results for individual datasets are shown in Supplementary Fig. 6d.

