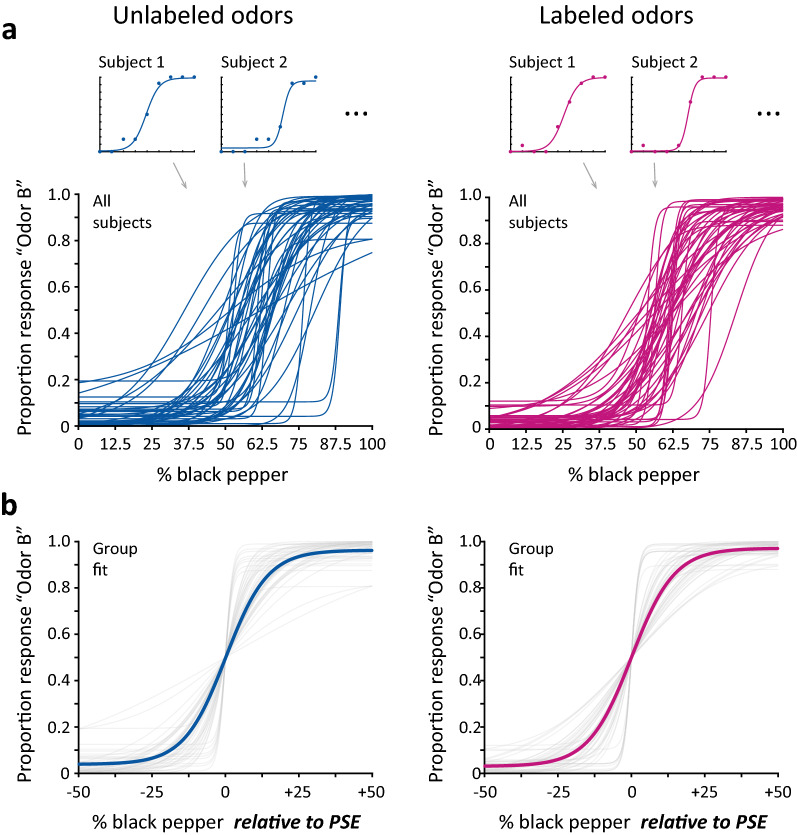
Figure 2.
Odor discrimination performance. (a) For each individual participant, we plotted the proportion of “B-like” responses as a function of odor mixture, ranging from 0% black pepper / 100% brown sugar to 100% black pepper / 0% brown sugar. We fit a logistic curve to each participant’s individual data, characterizing both the precision of odor discrimination (maximum slope of the curve) and the perceived midpoint of the stimulus range that was equally A-like and B-like (the point of subjective equality; PSE). Data plots from example subjects are shown for both the Unlabeled Odors and Labeled Odors conditions, and the curve fits from all participants are plotted together to show the variation in PSE. A 2-sample t-test found no difference in the precision of odor discrimination between groups (t(90) = 0.079, p = 0.938). (b) Group-level psychometric curve fits. After aligning participants’ data by PSE, we fit logistic curves to the aggregated group data for each condition. A permutation test found no difference between groups in the precision of odor discrimination, as given by the maximum slopes of the group-level curve fits (p = 0.981).

