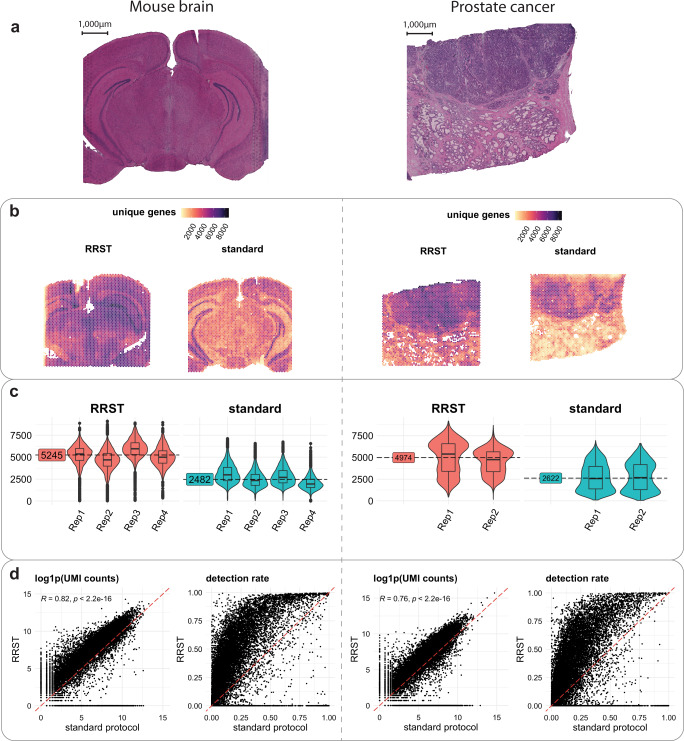
Fig. 1. Comparison of RRST and Visium on mouse brain and prostate tumor samples.
a H&E images of a representative tissue section from mouse brain (left) and prostate cancer (right). The entire dataset consisted of 8 consecutive mouse brain tissue sections and 4 consecutive prostate cancer tissue sections. Half of the tissue sections were processed with RRST and the remaining half with standard Visium protocol. b Spatial distribution of unique genes in two representative tissue sections for each tissue type, one processed with the RRST protocol and one processed with the standard Visium protocol. c Distributions of unique genes per spot visualized as violin/box plots colored by experimental protocol for mouse brain and prostate cancer data. Box plots are presented as median values where the lower and upper bounds are the 25th and 75th percentiles. The upper and lower limits of the boxplots are defined by the closest value no further than 1.5*IQR (inter-quartile range) from the closest bound. Values outside of the upper and lower limits are highlighted as outliers. The median number of unique genes is highlighted for each group (sample type and protocol) next to the violin plots. d gene-gene scatter plots between RRST data (y-axis) and standard Visium data (x-axis) of log1p-transformed UMI counts and detection rates using the data shown in (b). The UMI counts and detection rates were calculated across the pooled technical replicates within each experimental protocol. The red dashed line highlights a 1-to-1 relationship. For the log1p-transformed UMI counts scatter plot, only genes targeted by the probe panel were included. The detection rate for a gene is defined as the proportion of spots with detected UMI counts. The statistical test is based on the Pearson product moment correlation coefficient and p-values were estimated using a two-sided alternative hypothesis.

