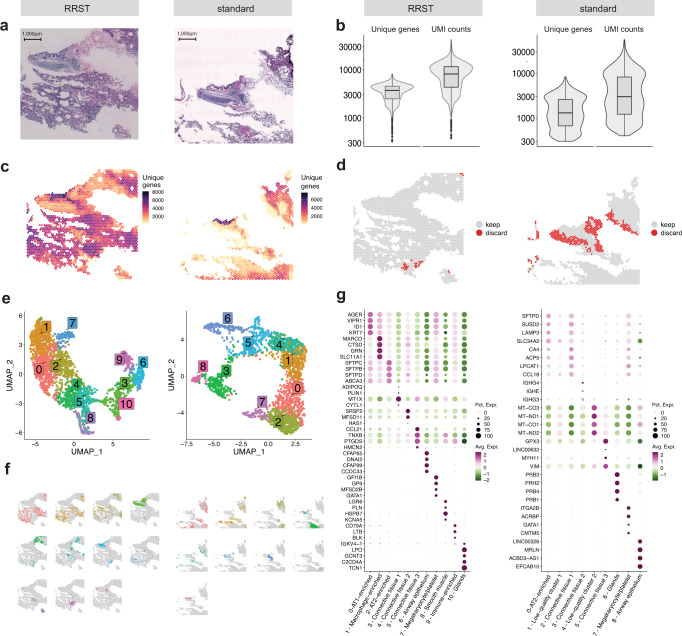
Fig. 2. RRST and standard Visium applied to human adult lung tissue.
Each subplot shows the RRST data on the left side and the standard Visium data on the right side. a H&E images of two representative tissue sections collected from the same tissue block. b Violin/box plots showing the distribution of unique genes and UMI counts for RRST (n = 1) and standard Visium (n = 2) data generated from consecutive tissue sections from the same lung tissue specimen. The y-axis is shown in log10 scale. Box plots are presented as median values where the lower and upper bounds are the 25th and 75th percentiles. The upper and lower limits of the boxplots are defined by the closest value no further than 1.5*IQR (inter-quartile range) from the closest bound. Values outside of the upper and lower limits are highlighted as outliers. c Unique genes per spot mapped on tissue coordinates. d Spatial visualization showing what spots were discarded due to low quality (less than 300 unique genes detected). e UMAP embedding of adult lung data colored by clusters detected by unsupervised graph-based clustering (louvain). f Split view of clusters (same as in e) mapped on tissue coordinates. g Dot plots of the top marker genes for each cluster. Each cluster was annotated based on its spatial localization in the tissue and expression of canonical marker genes.

