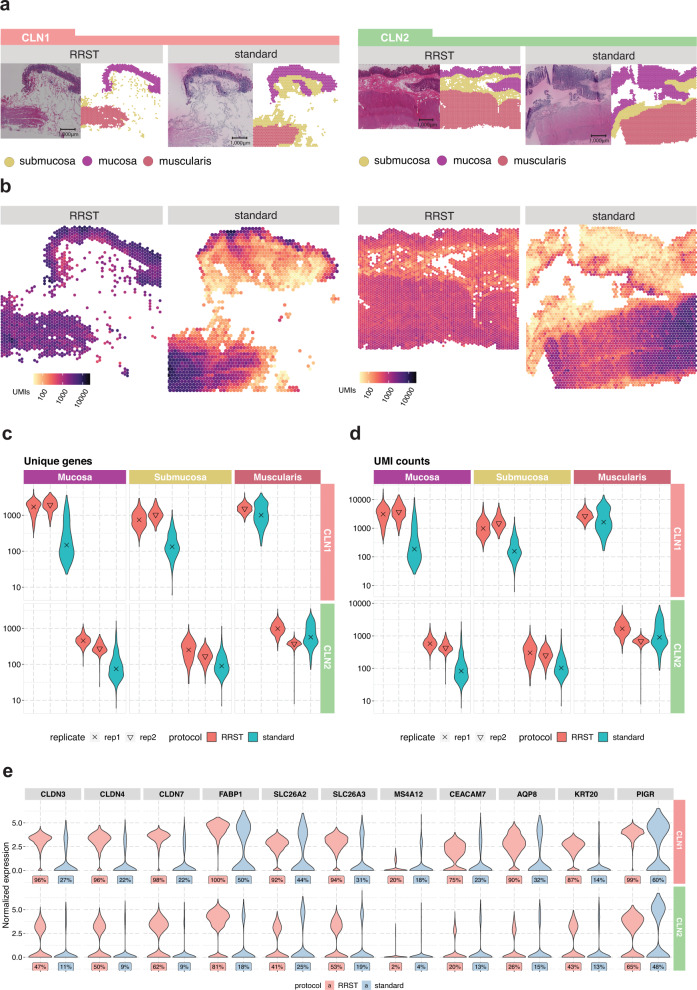
Fig. 3. Comparison of data quality in RRST and standard Visium datasets generated from adult human colon tissues.
a Representative H&E images and annotated regions for two patient samples processed by either RRST (n = 4) or standard Visium (n = 2) protocol. The spots in each tissue section were labeled into three categories: mucosa, submucosa, and muscularis. b Distribution of UMI counts in the tissue sections shown in (a). The color scale represents log10-transformed counts. c Distribution of unique genes per spot in the three annotated regions (mucosa, submucosa, and muscularis) visualized as violin plots, for all tissue sections. The y-axis shows log10-transformed counts. d Distribution of UMI counts per spot in the three annotated regions (mucosa, submucosa, and muscularis) visualized as violin plots. The y-axis shows log10-transformed counts. e Expression of 11 epithelial markers in the mucosa for the two adult colon samples visualized as violin plots. A comparison between the two protocols is shown for each gene and the corresponding detection rate is highlighted below each violin plot. The detection rate is defined as the percentage of spots (in the mucosa) where the gene is detected.

