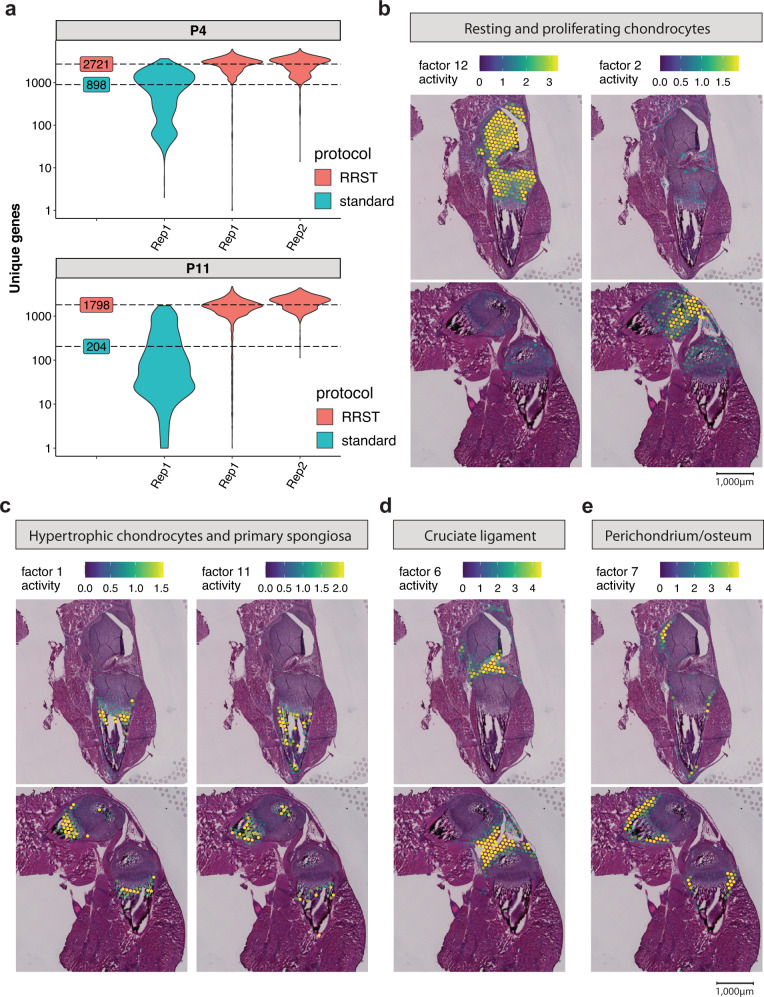
Fig. 6. Comparison of standard Visium with RRST on mouse cartilage tissue.
a Average numbers of unique genes are highlighted by dashed lines for each protocol next to the violin plots. The y-axis represents log10-scaled counts. 1 tissue section was processed with the standard Visium protocol for P4 and P11, and 2 tissue sections for each timepoint (P4, P11) with the RRST protocol. b Following NNMF, Factors 12 and 2 associated with resting and proliferating chondrocytes. c Factors 1 and 11 associated with hypertrophic chondrocytes and primary spongiosa. d Factor 6 associated with the cruciate ligament. e Factor 7 associated with Perichondrium and periosteum. Spot colors represent the factor activity, i.e., the contribution of each spot to the factor. The spot opacity has been scaled by the factor activity scores, making spots with lower scores more transparent.

