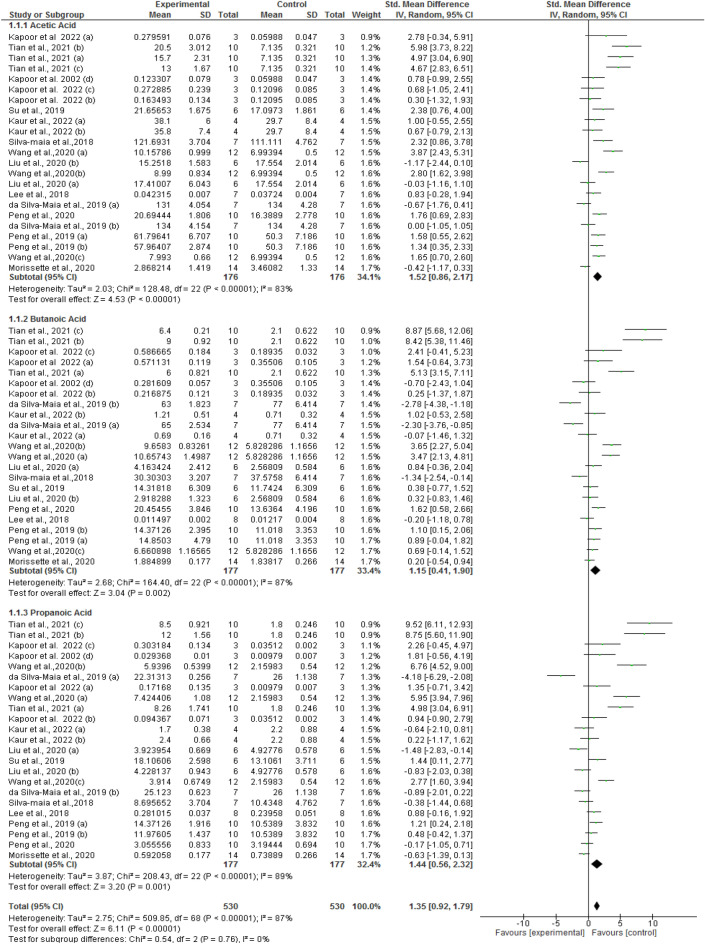
Figure 3.
Forest plot of studies investigating the effect of anthocyanin supplementation on the SCFA profile, sub-grouped by short chain fatty acid type. Pooled effect estimates are shown by diamonds after removing highly influencing studies. Values are standardized mean differences with 95% CIs determined with the use of random-effects models. Heterogeneity was quantified by I2, inverse variance and standardised mean difference [SMD].

